Written by Bystro THiNK
Not peer reviewed
Background: Gut microbiome composition differs across human populations, but whether these differences reflect race and ethnicity per se, or instead reflect correlated factors such as diet, body mass index (BMI), smoking, age, and sex, remains incompletely resolved in multi-ethnic United States cohorts. Methods: We analyzed shotgun metagenomic sequencing data from 866 stool samples from the Food and Microbiome Longitudinal Investigation (FAMiLI) study (NCBI BioProject PRJNA559143/SRP217703) [1]. After quality filtering (sequencing depth >=2,000 species-assigned reads and species prevalence >=10%), 730 participants with complete covariate data (self-reported race/ethnicity, age, sex, BMI, education, physical activity, smoking, and stool collection year) and 171 species-level taxa were retained for the primary analysis. We used centered log-ratio (CLR)-transformed Aitchison-distance permutational multivariate analysis of variance (PERMANOVA) to test the marginal (covariate-adjusted) association of race/ethnicity and eight other covariates with overall community structure, three independent differential-abundance methods (CLR-based, linear-model-based, and negative-binomial generalized-linear-model-based) to identify race/ethnicity-associated species, logistic regression to quantify carriage odds ratios for key species, and a permutation-tested multinomial classifier to assess whether microbiome composition alone predicts self-reported race/ethnicity group membership. Results: Race/ethnicity (four groups: non-Hispanic [NH] White, NH Asian, NH Black, Hispanic; n=730) was independently associated with Aitchison-distance community structure after adjusting for all other covariates (adjusted R-squared=1.33%, F=3.39, P<0.001, 9,999 permutations), the largest single-covariate effect among the nine terms tested, exceeding sequencing depth, collection year, sex, smoking, age, BMI, physical activity, and education. Seventeen of 171 species showed race/ethnicity-associated differential abundance that was concordant across all three independent statistical methods, most driven by the NH Asian versus NH White contrast (11 of 17 species). Carriage of Bacteroides plebeius and Bacteroides coprocola, species carrying horizontally transferred marine porphyranase/agarase genes [14,15,16], was markedly higher in NH Asian participants (adjusted odds ratio 4.59 and 7.45, respectively, versus NH White; both P<0.001), while Akkermansia muciniphila and Alistipes putredinis carriage was lower (odds ratio 0.43 and 0.37, respectively; both P<0.01). A multinomial classifier using microbiome composition alone predicted race/ethnicity group membership with macro-averaged area under the receiver-operating-characteristic curve (AUC)=0.795 (SD=0.006), far exceeding a label-permutation null distribution (mean AUC=0.502; permutation P=0.032). Age, BMI, and smoking were each independently associated with community structure at markedly smaller effect sizes (adjusted R-squared 0.36%, 0.27%, and 0.36%, respectively) and yielded fewer and less consistent differentially abundant species (3, 3, and 5 species robust across at least two of three methods, respectively) than race/ethnicity. Conclusions: In this cohort, self-reported race/ethnicity was associated with gut microbiome community structure and specific taxa independent of the measured demographic, anthropometric, and behavioral covariates available in this dataset. These findings are exploratory and hypothesis-generating; they likely reflect a combination of diet, environmental exposure, and other unmeasured social and behavioral factors that correlate with race/ethnicity rather than a direct biological effect of race/ethnicity itself, and they should not be interpreted as clinical or diagnostic findings.
Keywords: gut microbiome, race and ethnicity, health disparities, PERMANOVA, differential abundance, compositional data analysis, Bacteroides plebeius, Akkermansia muciniphila
The human gut microbiome varies substantially across individuals and populations, and this variation has been linked to diet, geography, host genetics, and the environment [5,6,7]. In the United States, several studies have reported differences in gut microbiome composition across self-identified racial and ethnic groups [8,10,11,12]. Because race and ethnicity are social constructs that correlate with diet, socioeconomic status, immigration history, and other exposures rather than direct causal biological categories, disentangling the independent statistical association of self-reported race/ethnicity with the microbiome from these correlated factors is an important and still unresolved methodological problem [9,13].
Prior work provides biologically plausible mechanisms by which specific taxa could differ by ancestry-linked dietary exposure. Bacteroides plebeius and the related species Bacteroides coprocola [15] can carry porphyranase and agarase genes horizontally acquired from marine bacteria, a genetic signature first described in Japanese individuals and linked to dietary seaweed (nori) consumption [14]. A large multi-country metagenomic survey subsequently confirmed that the porphyran-degradation gene system is markedly enriched in East Asian populations relative to other world regions and has spread horizontally into multiple Bacteroides/Phocaeicola lineages, including B. coprocola [16]. Other taxa, such as Akkermansia muciniphila, have been repeatedly associated with metabolic health and body composition [17,34], and sulfidogenic bacterial taxa have shown race-dependent associations with colorectal cancer risk [18,19]. Diet remains a dominant driver of inter-individual gut microbiome variation broadly [20], and diet plausibly mediates at least part of any race/ethnicity association with the microbiome [13].
The FAMiLI (Food and Microbiome Longitudinal Investigation) study is a multi-ethnic, Asian-American-enriched cohort designed to examine diet, lifestyle, and the gut microbiome across major US racial and ethnic groups [1]; related analyses from this cohort or related NYU cohorts have examined dietary fiber [2], tobacco smoking [3], and socioeconomic status [4] in relation to the gut microbiome. Building on this resource, we asked: after adjusting for age, sex, BMI, smoking, physical activity, education, stool collection year, and sequencing depth, is self-reported race/ethnicity still independently associated with overall gut microbiome community structure, and if so, which specific taxa drive this association, how large is the effect relative to the other measured covariates, and can microbiome composition alone predict race/ethnicity group membership? We addressed these questions using compositional-data-aware multivariate statistics, three independent differential-abundance testing frameworks, carriage-based logistic regression, and a permutation-tested classifier, and we report the race/ethnicity association alongside parallel analyses of age, BMI, and smoking status as points of comparison. All analyses are exploratory and hypothesis-generating and are not intended to support any clinical or diagnostic use.
Shotgun metagenomic sequencing data and de-identified participant metadata for 866 stool samples were obtained from the publicly deposited FAMiLI cohort (NCBI BioProject PRJNA559143, SRA study accession SRP217703) [1]; a SraRunTable metadata export (866 rows, one per run accession) and a species-level read-count table (866 rows x 733 species-level columns) were used as the raw inputs. Available covariates included age, BMI, self-reported sex, self-reported race/ethnicity (non-Hispanic [NH] White, NH Asian, NH Black, or Hispanic), education level, weekly physical activity, cigarette smoking history (ever/never), stool collection year (2016-2018), and total raw and species-assigned read counts per sample.
A total of 11,539,449 species-assigned reads were distributed across 866 samples and 733 species-level taxa; the raw feature table was 90.0% zero entries, consistent with the expected sparsity of species-level shotgun metagenomic data. Across all 866 samples, median species-assigned read depth was 13,715 (interquartile range [IQR] 6,567-18,692), and a mean of 88.3% of raw reads were assigned to a species. Samples with fewer than 2,000 species-assigned reads were excluded (n=80 excluded, 786 retained) to avoid unstable compositional estimates at very low depth; this depth threshold was varied in sensitivity analyses (below). Species were retained for the primary analysis if present (nonzero count) in at least 10% of the depth-filtered samples, retaining 171 of 733 species-level taxa and 94.8% of total assigned reads; the prevalence threshold was likewise varied in sensitivity analyses. After further restricting to samples with complete data for all eight covariates (race/ethnicity, age, sex, BMI, education, physical activity, smoking, and collection year), 730 participants remained for the primary analysis (NH White n=277, NH Asian n=250, NH Black n=75, Hispanic n=128). Alpha-diversity metrics (observed richness, Shannon index, Simpson index, Chao1 richness [35], and Pielou's evenness) were computed on counts rarefied to 2,000 reads per sample to remove the confounding of read depth on richness/diversity estimates.
Because sequencing-based microbiome count data are compositional (constrained to a fixed total per sample), zeros in the 171-species filtered table were replaced with a pseudocount of 0.5 (varied to 1.0 in sensitivity analysis), counts were converted to proportions, and proportions were centered-log-ratio (CLR) transformed [22,21] prior to distance calculation and univariate modeling. Aitchison distance (Euclidean distance on CLR-transformed data) was used as the primary beta-diversity metric, with Bray-Curtis dissimilarity [30] on proportions used as a secondary/robustness metric. Principal coordinates analysis (PCoA) was used for visualization of the Aitchison-distance matrix.
Community-level associations with each covariate were tested using permutational multivariate analysis of variance (PERMANOVA) [27] on the full Aitchison-distance matrix (N=730), with 9,999 permutations. All nine covariates (race/ethnicity, sequencing depth [log10], collection year, sex, smoking, age, BMI, physical activity, and education) were entered into a single model, and marginal (Type III, i.e., each term tested after adjusting for all other terms) sums of squares and R-squared were reported as the primary adjusted effect size for each covariate; unadjusted (univariable) R-squared for each covariate is reported alongside for reference. Permutations for race/ethnicity, sex, smoking, age, BMI, physical activity, and education used residual permutation under the full model following a Freedman-Lane-style approach [29] to account for the other covariates. Multivariate dispersion (within-group spread) was compared across race/ethnicity groups using PERMDISP [28] on both Aitchison and Bray-Curtis distances to determine whether any race/ethnicity association with distance reflected a difference in group centroids (location) versus a difference in within-group variability (dispersion). Pairwise PERMANOVA contrasts between each pair of race/ethnicity groups were computed with Benjamini-Hochberg false-discovery-rate (FDR) correction [26] across the six pairwise tests. Because collection year and race/ethnicity were strongly associated in this cohort (Cramer's V=0.57, reflecting recruitment-wave differences across groups), a within-year (stratum-restricted) sensitivity PERMANOVA was also run, comparing pairs of race/ethnicity groups only within samples collected in the same year.
Species-level differential abundance by race/ethnicity, age, BMI, and smoking status was tested independently using three complementary methods representing distinct statistical assumptions, following the general logic of compositional differential-abundance benchmarking: (A) a CLR-based method in the style of ALDEx2 [23], modeling CLR-transformed abundance with a linear model per species; (B) a linear-model-based method in the style of MaAsLin2 [24], modeling arcsine-square-root or CLR-transformed relative abundance with covariate adjustment; and (C) a negative-binomial generalized linear model on raw counts with a log-offset for sequencing depth, conceptually related to bias-correction approaches such as ANCOM-BC [25]. For the race/ethnicity analysis, all three methods were adjusted for age, sex, BMI, education, physical activity, smoking, collection year, and sequencing depth; for the age, BMI, and smoking analyses, models were adjusted for the remaining seven covariates including race/ethnicity. Within each method, P-values across the 171 species were converted to Benjamini-Hochberg q-values [26]. A species was classified as "primary" (robust) evidence for race/ethnicity if it reached q<0.05 in all three methods (A, B, and C); for age, BMI, and smoking, where far fewer species reached significance in every method, a species was classified as robust if it reached q<0.05 in at least two of the three methods. Effect sizes are reported as the CLR-scale regression coefficient (beta) with 95% confidence intervals for the strongest pairwise contrast (NH Asian vs. NH White for race/ethnicity) and, where applicable, as the base-2 logarithm of the fold-change in total-sum-scaled (TSS) relative abundance.
For five species highlighted by the differential-abundance analysis (Bacteroides plebeius, Bacteroides coprocola, Akkermansia muciniphila, an unassigned Bifidobacterium species, and Alistipes putredinis), carriage (presence versus absence of the species in a sample, i.e., nonzero versus zero read count) was modeled with multivariable logistic regression, adjusted for the same eight covariates, with NH White as the reference race/ethnicity group; results are reported as adjusted odds ratios (OR) with 95% confidence intervals. Rarefied alpha-diversity metrics were compared across race/ethnicity groups using both an unadjusted Kruskal-Wallis test and a covariate-adjusted linear/ANOVA model, each followed by Benjamini-Hochberg FDR correction across the five alpha-diversity metrics. A multinomial (one-vs-rest) logistic-regression classifier using the CLR-transformed 171-species profile as predictors was trained with cross-validation to predict race/ethnicity group membership; performance was summarized as the macro-averaged area under the receiver-operating-characteristic curve (AUC) across the four groups and as group-specific one-vs-rest AUCs, and statistical significance was assessed by comparing the observed macro-AUC (mean and SD across cross-validation folds/repeats) against a null distribution generated by repeatedly permuting race/ethnicity labels and re-running the identical classification pipeline; the permutation P-value was computed as (1 + number of permuted-null macro-AUCs >= observed mean macro-AUC) / (1 + number of permutations).
To assess robustness of the primary race/ethnicity PERMANOVA and B. plebeius carriage-OR results, seven sensitivity scenarios were run, varying the minimum-depth threshold (1,000, 2,000 [primary], and 5,000 reads), the species-prevalence threshold (5%, 10% [primary], and 20%), the pseudocount used before CLR transformation (0.5 [primary] and 1.0), and the beta-diversity distance metric (Aitchison [primary] and Bray-Curtis). All statistical computing used Python-based scientific-computing libraries, including NumPy [39], SciPy [38], and scikit-learn [40] for the classifier and permutation testing; taxonomic nomenclature for Bacteroidetes/Bacteroidota species follows the type-strain-genome-based classification of Garcia-Lopez et al. [33]. This report follows relevant elements of the STORMS reporting guideline for human microbiome research [37]. Reporting of amplicon/metagenomic pipelines in the broader field, for context, commonly uses QIIME2 [31] and Deblur [32]-style workflows; the present analysis used a pre-computed species-level count table rather than re-processing raw sequencing reads. Statistical significance was set at alpha=0.05 for PERMANOVA terms and at q<0.05 (FDR-adjusted) for all species-level and alpha-diversity multiple-comparison tests.
Of 866 sequenced samples, 80 (9.2%) were excluded for species-assigned read depth below 2,000 reads, and a further 56 were excluded for missing covariate data, leaving 730 participants for the primary analysis (Table 1). Median species-assigned sequencing depth in the analytic sample was 14,604 reads (IQR 9,098-19,475), broadly similar across race/ethnicity groups (range of group medians 13,897-15,427 reads), arguing against gross differential sequencing depth as a confound of the race/ethnicity comparisons below (Table 1). Rarefied alpha-diversity (observed richness and Shannon index at 2,000 reads) was similar across race/ethnicity groups on unadjusted comparison (Kruskal-Wallis P=0.19 and P=0.26, respectively). The race/ethnicity groups differed markedly in age, sex distribution, BMI, obesity prevalence, smoking history, educational attainment, and stool-collection year (Table 1), and collection year was strongly associated with race/ethnicity (Cramer's V=0.57) because of cohort recruitment-wave patterns (NH Asian and Hispanic participants predominantly enrolled in 2016; NH White and NH Black participants predominantly enrolled in 2017). All PERMANOVA and differential-abundance models below therefore explicitly adjusted for collection year alongside the other covariates, and a within-year sensitivity analysis is reported separately.
| Characteristic | NH White | NH Asian | NH Black | Hispanic | Overall |
|---|---|---|---|---|---|
| n | 277 | 250 | 75 | 128 | 730 |
| Age, years, mean (SD) | 57.7 (10.2) | 65.1 (11.5) | 54.5 (8.8) | 56.4 (9.8) | 59.6 (11.2) |
| Female, n (%) | 152 (54.9) | 170 (68.0) | 52 (69.3) | 89 (69.5) | 463 (63.4) |
| BMI, kg/m², mean (SD) | 28.4 (6.5) | 23.8 (3.5) | 31.2 (7.6) | 29.6 (6.8) | 27.3 (6.4) |
| Obesity (BMI ≥30), n (%) | 91 (32.9) | 13 (5.2) | 39 (52.0) | 56 (43.8) | 199 (27.3) |
| Ever smoker, n (%) | 110 (39.7) | 52 (20.8) | 27 (36.0) | 44 (34.4) | 233 (31.9) |
| College graduate or higher, n (%) | 211 (76.2) | 124 (49.6) | 43 (57.3) | 24 (18.8) | 402 (55.1) |
| Exercise ≥4 h/week, n (%) | 94 (33.9) | 89 (35.6) | 17 (22.7) | 27 (21.1) | 227 (31.1) |
| No weekly exercise, n (%) | 27 (9.7) | 38 (15.2) | 5 (6.7) | 32 (25.0) | 102 (14.0) |
| Stool collected 2016, n (%) | 23 (8.3) | 221 (88.4) | 7 (9.3) | 101 (78.9) | 352 (48.2) |
| Stool collected 2017, n (%) | 190 (68.6) | 21 (8.4) | 53 (70.7) | 17 (13.3) | 281 (38.5) |
| Stool collected 2018, n (%) | 64 (23.1) | 8 (3.2) | 15 (20.0) | 10 (7.8) | 97 (13.3) |
| Species-assigned reads, median (IQR) | 13,897 (8,000–17,960) | 15,427 (9,633–20,215) | 14,349 (8,900–19,880) | 14,868 (10,103–20,433) | 14,604 (9,098–19,475) |
| Observed richness @2000 reads, mean (SD) | 71.6 (19.1) | 69.4 (18.4) | 71.6 (20.1) | 73.3 (18.5) | 71.1 (18.8) |
| Shannon @2000 reads, mean (SD) | 3.2 (0.4) | 3.1 (0.4) | 3.2 (0.4) | 3.2 (0.4) | 3.2 (0.4) |
In a single PERMANOVA model containing all nine covariates, race/ethnicity showed the largest adjusted (marginal) effect size on Aitchison-distance community structure of any covariate tested (adjusted R²=1.33%, F=3.39, P<0.001, 9,999 permutations; Table 2, Figure 1B), exceeding sequencing depth (adjusted R²=1.14%), collection year (0.51%), sex (0.40%), smoking (0.36%), age (0.36%), BMI (0.27%), physical activity (0.16%, P=0.09, not significant), and education (0.15%, P=0.24, not significant). Together, all nine covariates explained 6.39% of total Aitchison-distance variance. The same qualitative ranking (race/ethnicity as the largest single covariate effect) was obtained using Bray-Curtis dissimilarity as a secondary distance metric. Principal coordinates analysis of the Aitchison-distance matrix showed partial, non-discrete separation of race/ethnicity groups along the first two axes (PCo1=8.5%, PCo2=6.3% of total variance; Figure 1A), consistent with a real but modest shift in typical community composition rather than fully distinct clusters.
Multivariate dispersion (within-group spread) did not differ significantly across race/ethnicity groups on either distance metric (PERMDISP: Aitchison F=2.08, P=0.107; Bray-Curtis F=0.21, P=0.895), indicating that the PERMANOVA association reflects a shift in typical (centroid) community composition across groups rather than a difference in within-group heterogeneity. Pairwise contrasts (Table 2 footnote; full results in Supplementary analysis) showed the NH White vs. NH Asian contrast as the strongest pairwise difference after FDR correction (adjusted R²=0.73%, q=0.0003), followed by NH Asian vs. Hispanic (adjusted R²=0.93%, q=0.0003) and NH Asian vs. NH Black (adjusted R²=0.62%, q=0.0006); NH Black vs. Hispanic was not significant after adjustment (q=0.87). A within-year sensitivity analysis, restricting each pairwise contrast to samples collected in the same calendar year to remove any residual confounding by collection wave, confirmed a significant NH Asian association in both the 2016 stratum (Hispanic vs. NH Asian, R²=1.03%, P<0.001) and the 2017 stratum (NH White vs. NH Asian, R²=0.88%, P=0.0015), supporting that the race/ethnicity association is not solely an artifact of the collection-year confound.
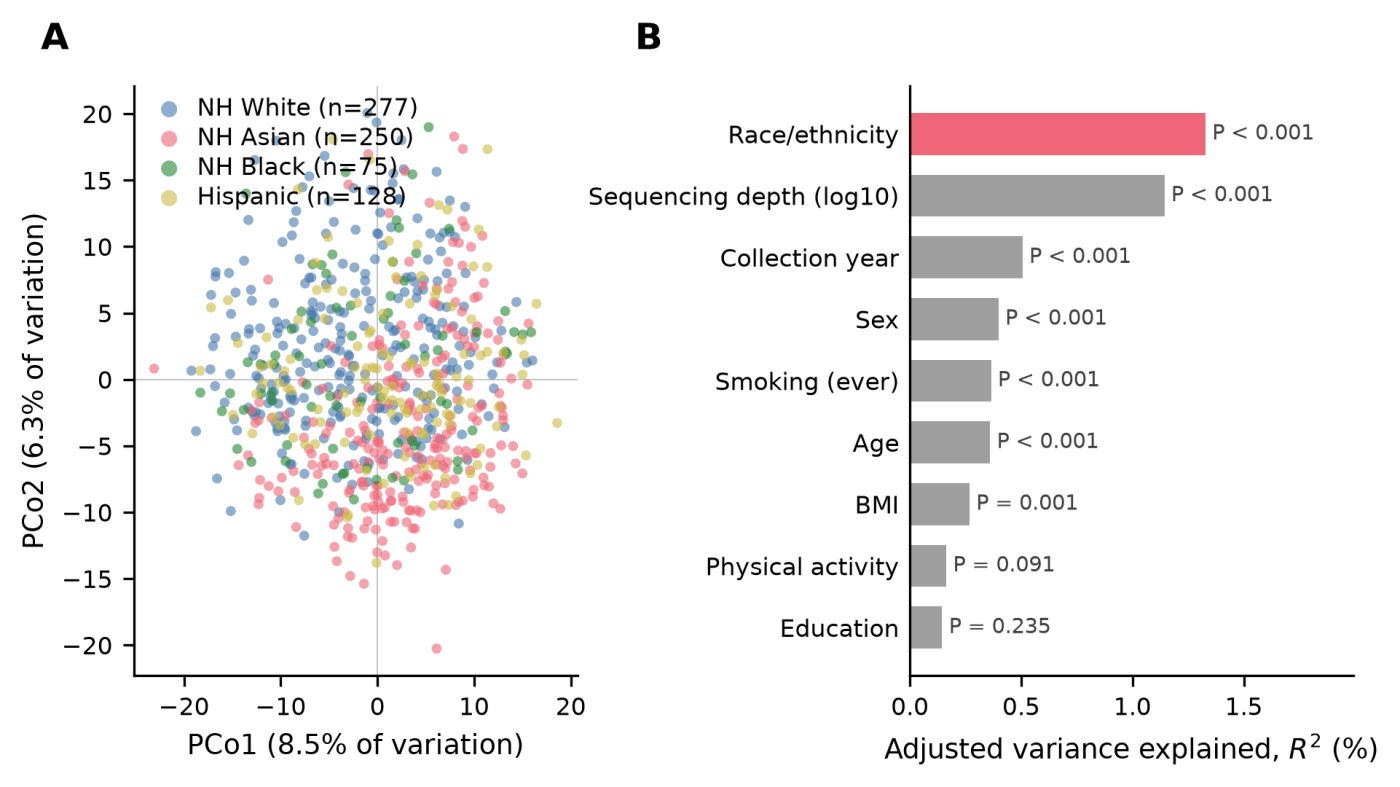
Figure 1. Race/ethnicity is associated with gut microbiome community structure independent of other covariates. (A) Principal coordinates analysis (PCoA) of Aitchison distance for 730 participants, colored by self-reported race/ethnicity. PCo1 and PCo2 explain 8.5% and 6.3% of total variance, respectively. (B) Adjusted (marginal) PERMANOVA R² for each of nine covariates modeled jointly (9,999 permutations, N=730); race/ethnicity (highlighted) shows the largest effect size. P-values are adjusted (marginal) values from the joint model.
| Covariate | df | Adj. R² (%) | F | P (adj.) | Unadj. R² (%) | P (unadj.) |
|---|---|---|---|---|---|---|
| Race/ethnicity | 3 | 1.33 | 3.39 | <0.001 | 3.07 | <0.001 |
| Sequencing depth (log10) | 1 | 1.14 | 8.76 | <0.001 | 1.14 | <0.001 |
| Collection year | 2 | 0.51 | 1.94 | <0.001 | 1.97 | <0.001 |
| Sex | 1 | 0.40 | 3.05 | <0.001 | 0.25 | 0.004 |
| Smoking (ever) | 1 | 0.36 | 2.79 | <0.001 | 0.54 | <0.001 |
| Age | 1 | 0.36 | 2.76 | <0.001 | 0.45 | <0.001 |
| BMI | 1 | 0.27 | 2.05 | 0.001 | 0.64 | <0.001 |
| Physical activity | 1 | 0.16 | 1.26 | 0.091 | 0.24 | 0.004 |
| Education | 1 | 0.15 | 1.11 | 0.235 | 0.50 | <0.001 |
Across the three independent differential-abundance methods, 19, 63, and 71 of 171 species reached q<0.05 for race/ethnicity in methods A (CLR-based), B (linear-model-based), and C (negative-binomial GLM-based), respectively; 17 species reached q<0.05 in all three methods and were classified as robust ("primary") race/ethnicity-associated taxa (Figure 2A). Eleven of these 17 species (65%) were significantly associated specifically with the NH Asian versus NH White contrast, consistent with the pairwise PERMANOVA results above showing NH Asian as the group most distinct from NH White.
The species with the largest robust CLR effect size for the NH Asian versus NH White contrast was Bacteroides plebeius (CLR beta=2.18, 95% CI 1.19-3.17, higher in NH Asian), a species that, together with the related species Bacteroides coprocola [15], carries porphyranase and agarase genes horizontally acquired from marine bacteria and linked in prior work to dietary seaweed exposure and East Asian populations [14,16]. Akkermansia muciniphila and Alistipes putredinis showed the opposite direction, with significantly lower CLR-scale abundance in NH Asian participants (CLR beta=-1.67 and -1.71, respectively; Figure 2A). In terms of mean relative abundance, B. plebeius averaged 2.10% relative abundance in NH Asian participants versus 0.36% in NH White participants, and B. coprocola averaged 0.96% versus 0.19%, respectively (Figure 2B); Akkermansia muciniphila and Alistipes putredinis showed correspondingly lower mean relative abundance in NH Asian participants relative to NH White (Figure 2B).
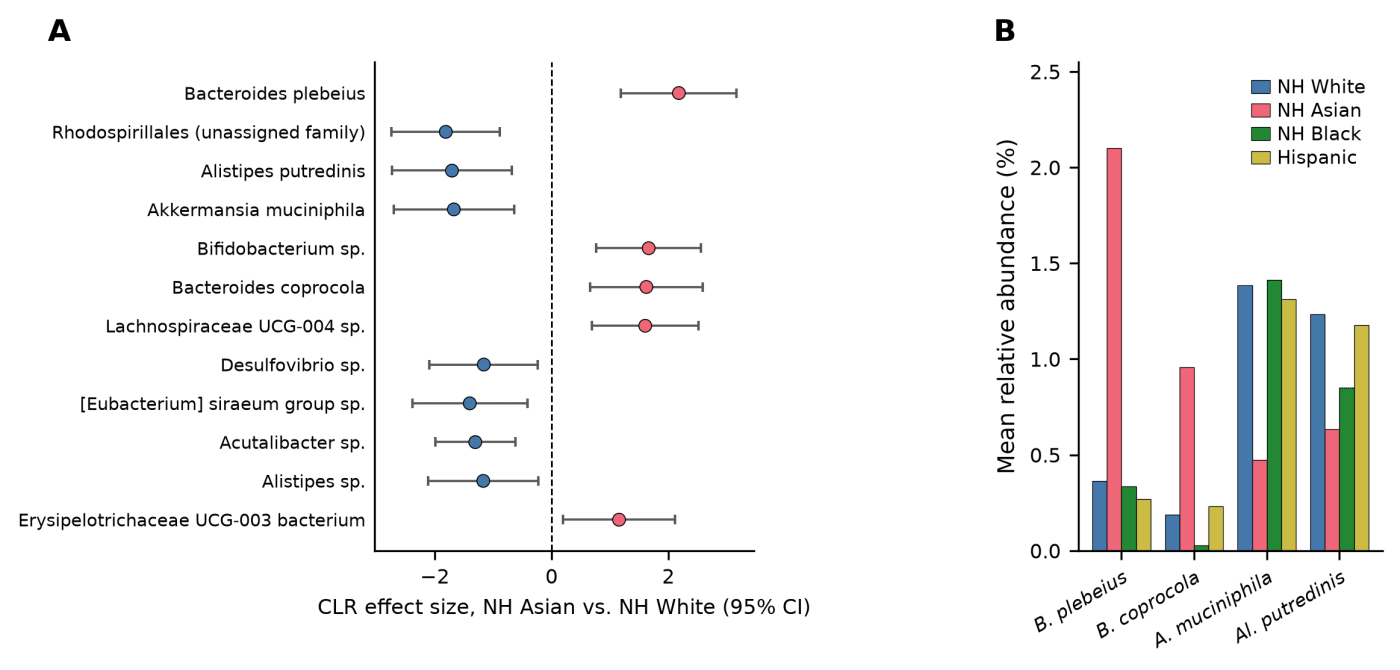
Figure 2. Species-level differential abundance associated with race/ethnicity. (A) CLR-scale effect size (NH Asian vs. NH White), with 95% confidence intervals, for the 14 species with the largest effect size among the 17 species reaching q<0.05 for race/ethnicity in all three independent differential-abundance methods. (B) Mean relative abundance (%) of four key species by race/ethnicity group.
Multivariable logistic regression confirmed that carriage (presence versus absence) of Bacteroides plebeius and Bacteroides coprocola was substantially more common in NH Asian participants than NH White participants after adjustment for age, sex, BMI, education, physical activity, smoking, collection year, and sequencing depth (adjusted odds ratio [OR] 4.59, 95% CI 2.19-9.60, P<0.001 for B. plebeius; OR 7.45, 95% CI 3.14-17.67, P<0.001 for B. coprocola; Table 3). Carriage of an unassigned Bifidobacterium species was also significantly higher in both NH Asian (OR 3.13, P=0.001) and Hispanic participants (OR 3.42, P=0.002) relative to NH White. In contrast, carriage of Akkermansia muciniphila and Alistipes putredinis was significantly lower in NH Asian participants (OR 0.43, P=0.003 and OR 0.37, P<0.001, respectively) and, for both species, nominally or significantly lower in NH Black participants as well (Table 3). None of the five species showed a statistically significant carriage difference for the Hispanic versus NH White contrast except the Bifidobacterium species, consistent with the pairwise PERMANOVA finding that the NH White versus Hispanic community-level contrast was comparatively weak after FDR correction (q=0.053, borderline).
| Species | NH Asian, OR (95% CI) | P | NH Black, OR (95% CI) | P | Hispanic, OR (95% CI) | P |
|---|---|---|---|---|---|---|
| Bacteroides plebeius | 4.59 (2.19–9.60) | <0.001 | 0.69 (0.23–2.12) | 0.521 | 0.69 (0.27–1.79) | 0.450 |
| Bacteroides coprocola | 7.45 (3.14–17.67) | <0.001 | 0.44 (0.10–2.01) | 0.292 | 1.36 (0.48–3.89) | 0.565 |
| Akkermansia muciniphila | 0.43 (0.25–0.75) | 0.003 | 0.56 (0.32–0.99) | 0.045 | 1.70 (0.94–3.08) | 0.080 |
| Bifidobacterium sp. sp. | 3.13 (1.56–6.27) | 0.001 | 1.40 (0.78–2.53) | 0.260 | 3.42 (1.54–7.58) | 0.002 |
| Alistipes putredinis | 0.37 (0.22–0.64) | <0.001 | 0.51 (0.30–0.86) | 0.012 | 0.95 (0.52–1.72) | 0.863 |
A multinomial classifier trained on the CLR-transformed 171-species profile predicted self-reported race/ethnicity group membership with macro-averaged AUC=0.795 (SD=0.006) across cross-validation repeats, substantially exceeding a label-permutation null distribution (mean null macro-AUC=0.502, maximum null macro-AUC=0.534 across 30 permutations; permutation P=0.032, i.e., 1 of 30 permuted-null values met or exceeded the observed value). Group-specific one-vs-rest AUCs were highest for NH Asian (0.927) and lowest for NH Black (0.711) and Hispanic (0.717), with NH White intermediate (0.827), indicating that the NH Asian microbiome profile was the most distinguishable from the other groups combined, consistent with the pairwise PERMANOVA and differential-abundance results above. A simplified binary classifier restricted to NH Asian versus all other groups achieved AUC=0.934, and out-of-fold AUCs computed within the 2016 collection-year stratum alone (removing between-year confounding) remained high (AUC=0.905), further supporting that the classifier is not solely detecting the collection-year batch effect.
Age was independently associated with community structure (adjusted PERMANOVA R²=0.36%, P<0.001; Table 2). Akkermansia muciniphila log2 relative abundance showed a positive adjusted trend with age in both sexes (male P=0.003; female P=0.09, same direction; Figure 3A); note that 416 of 730 participants (57%) had zero detected A. muciniphila reads, and the log2 abundance for these samples is floored at the pseudocount value in Figure 3A. This direction agrees with recent large cohort studies reporting higher A. muciniphila abundance in older adults, although other cohorts have reported the opposite pattern, and the age-abundance relationship is not considered uniform in the literature [17]. Rarefied Shannon diversity increased modestly with age quartile after covariate adjustment (P=0.038; Figure 3B), but only 3 of 171 species reached robust (>=2 of 3 methods) evidence for age-associated differential abundance, far fewer than the 17 robust species found for race/ethnicity (Figure 6B).
BMI was independently associated with community structure at a smaller effect size than race/ethnicity (adjusted PERMANOVA R²=0.27%, P=0.001; Table 2). Observed richness showed a borderline overall adjusted trend with BMI category (P=0.058; Figure 4A) that was not consistent by sex: the BMI-richness association was nominally significant in female participants (P=0.038) but not in male participants (P=0.89) when stratified (Figure 4B), indicating this association is not robust across sexes in this cohort. Only 3 of 171 species reached robust evidence for BMI-associated differential abundance.
Smoking history (ever vs. never) was independently associated with community structure (adjusted PERMANOVA R²=0.36%, P<0.001; Table 2), a similar effect size to age. PCoA showed substantial overlap between never- and ever-smokers (Figure 5A). Five of 171 species reached robust (>=2 of 3 methods) evidence for smoking-associated differential abundance (Figure 5B), more than age or BMI but still fewer than the 17 robust race/ethnicity-associated species, and none reached significance in all three methods simultaneously (method A, the most conservative CLR-based test, detected zero smoking-associated species at q<0.05; Figure 6B).
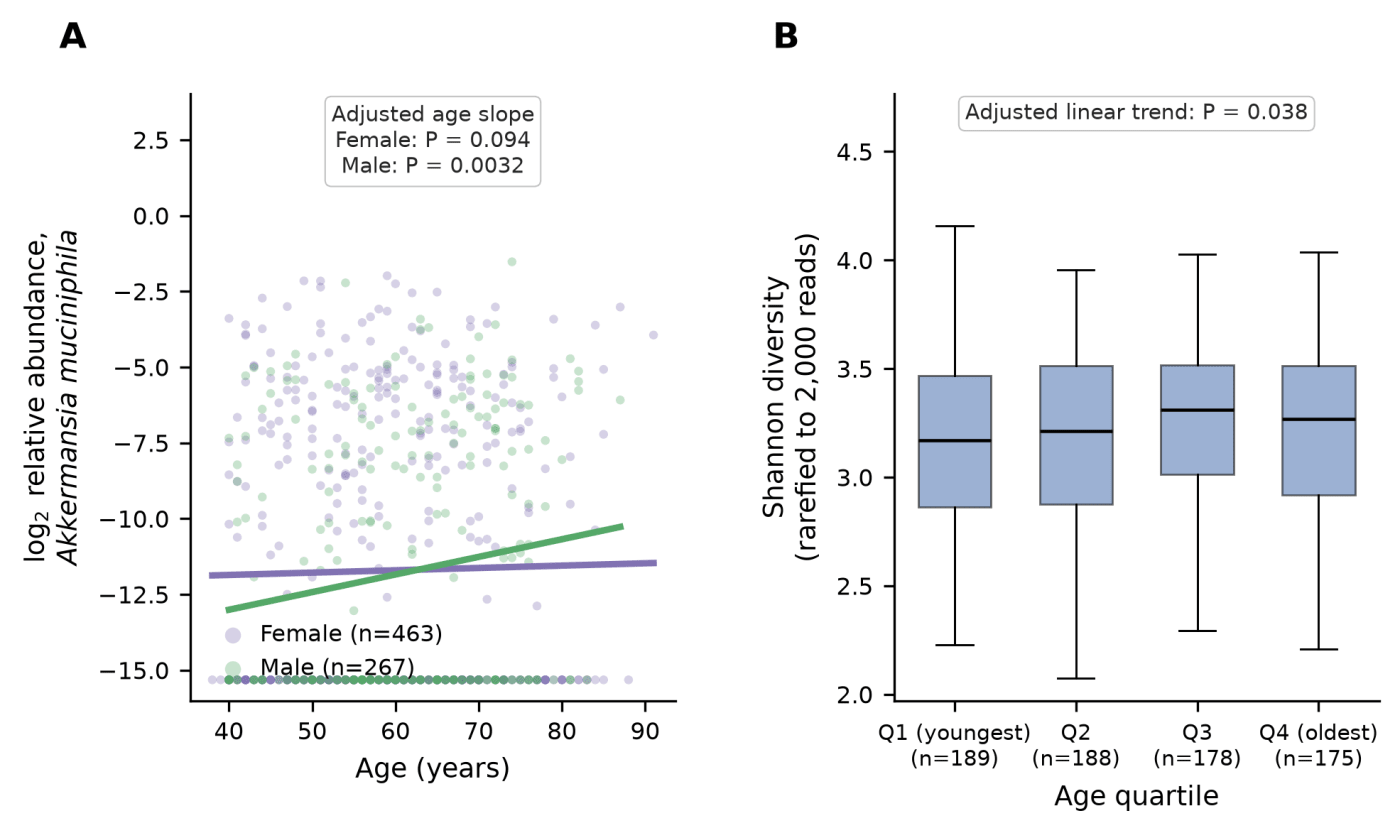
Figure 3. Age-associated microbiome patterns. (A) log2(relative abundance) of Akkermansia muciniphila versus age, by sex, with linear trend lines (adjusted P=0.09 in females, P=0.003 in males, same direction). Because Akkermansia muciniphila was undetected in 416/730 participants (57%), these zero-count samples appear as a floor at the pseudocount-derived log2 value (approximately -15.3) and should not be read as true negative abundance values. (B) Rarefied Shannon diversity by age quartile (covariate-adjusted linear trend P=0.038).
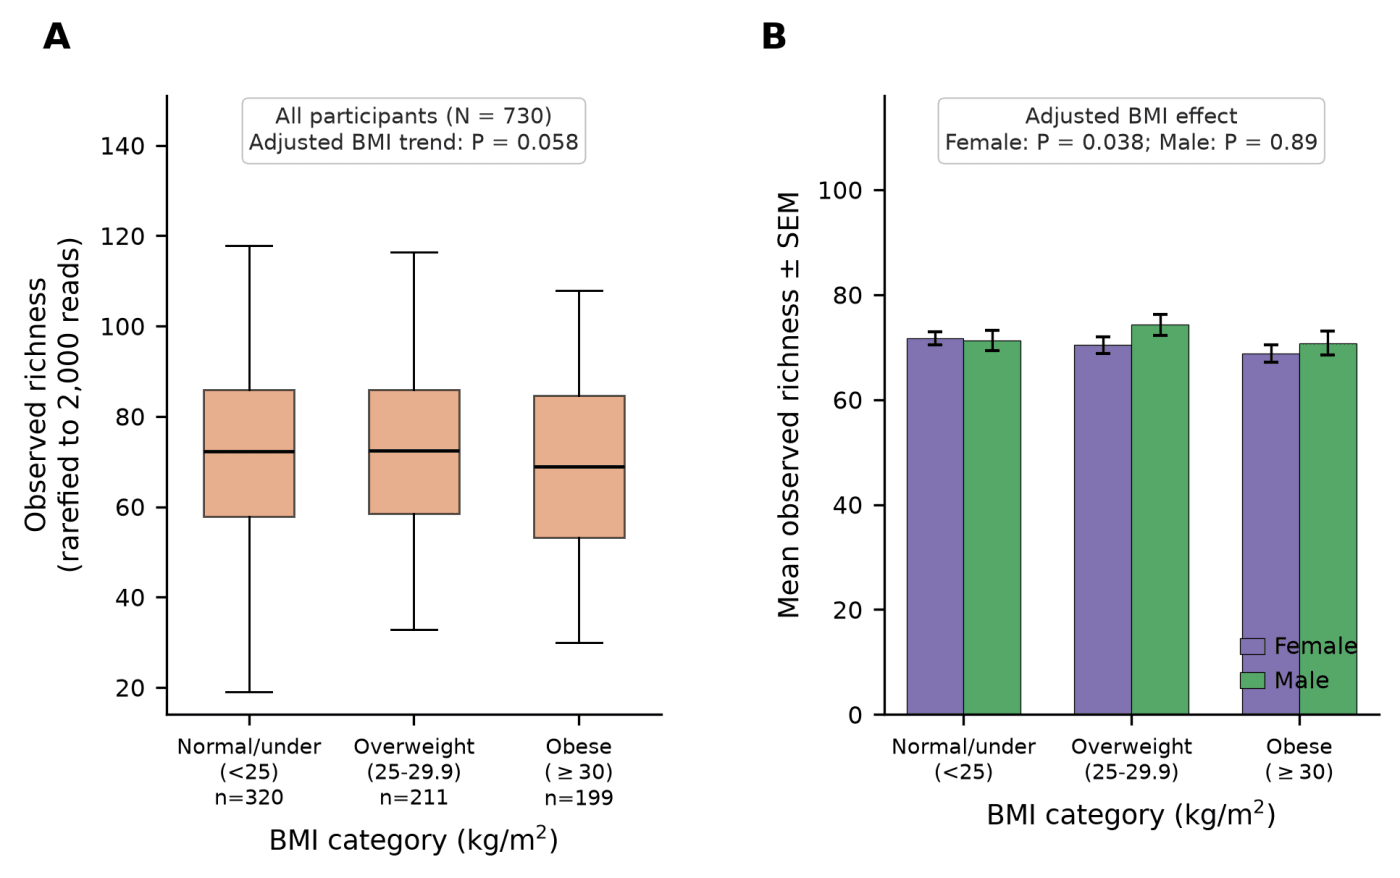
Figure 4. BMI-associated microbiome patterns. (A) Rarefied observed richness by BMI category for all participants (covariate-adjusted linear trend P=0.058). (B) The same relationship stratified by sex; the adjusted BMI effect was nominally significant in females (P=0.038) but not in males (P=0.89), indicating the overall trend is not robust across sexes.
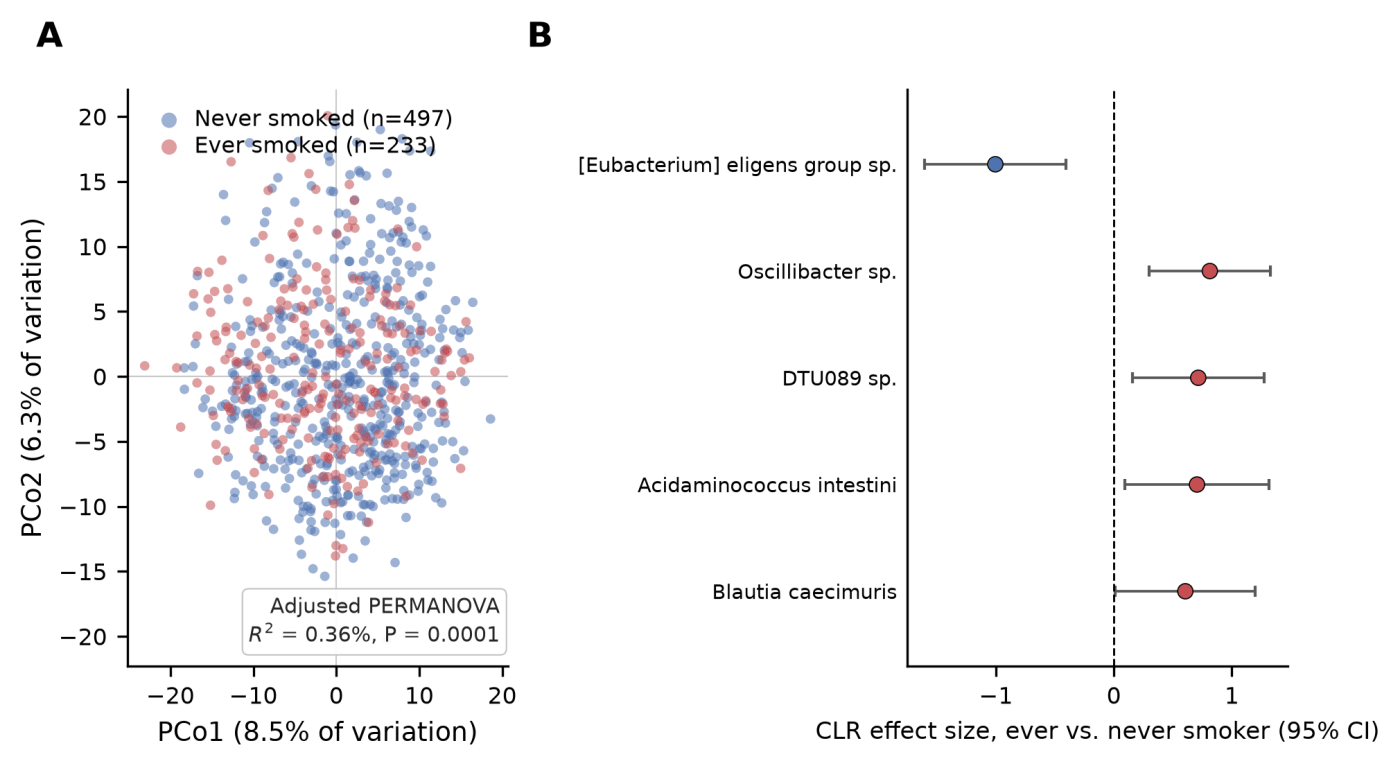
Figure 5. Smoking-associated microbiome patterns. (A) PCoA of Aitchison distance by smoking history (adjusted PERMANOVA R²=0.36%, P<0.001). (B) CLR-scale effect size (ever vs. never smoked), with 95% confidence intervals, for the 5 species reaching robust (≥2 of 3 methods) evidence of smoking-associated differential abundance; this is weaker evidence than the 17-species robust set identified for race/ethnicity.
Directly comparing the four factors examined for differential abundance, race/ethnicity produced both the largest adjusted PERMANOVA effect size and the most consistent differential-abundance signal: 17 robust species for race/ethnicity versus 3, 3, and 5 robust species for age, BMI, and smoking, respectively (Figure 6). Notably, method A (the most conservative, CLR-based test) identified zero significant species at q<0.05 for age, BMI, or smoking, but 19 species for race/ethnicity, underscoring that the race/ethnicity association is detectable even under the most conservative statistical approach used here, whereas the age, BMI, and smoking associations were only detected by the less conservative linear and negative-binomial methods (Figure 6B).
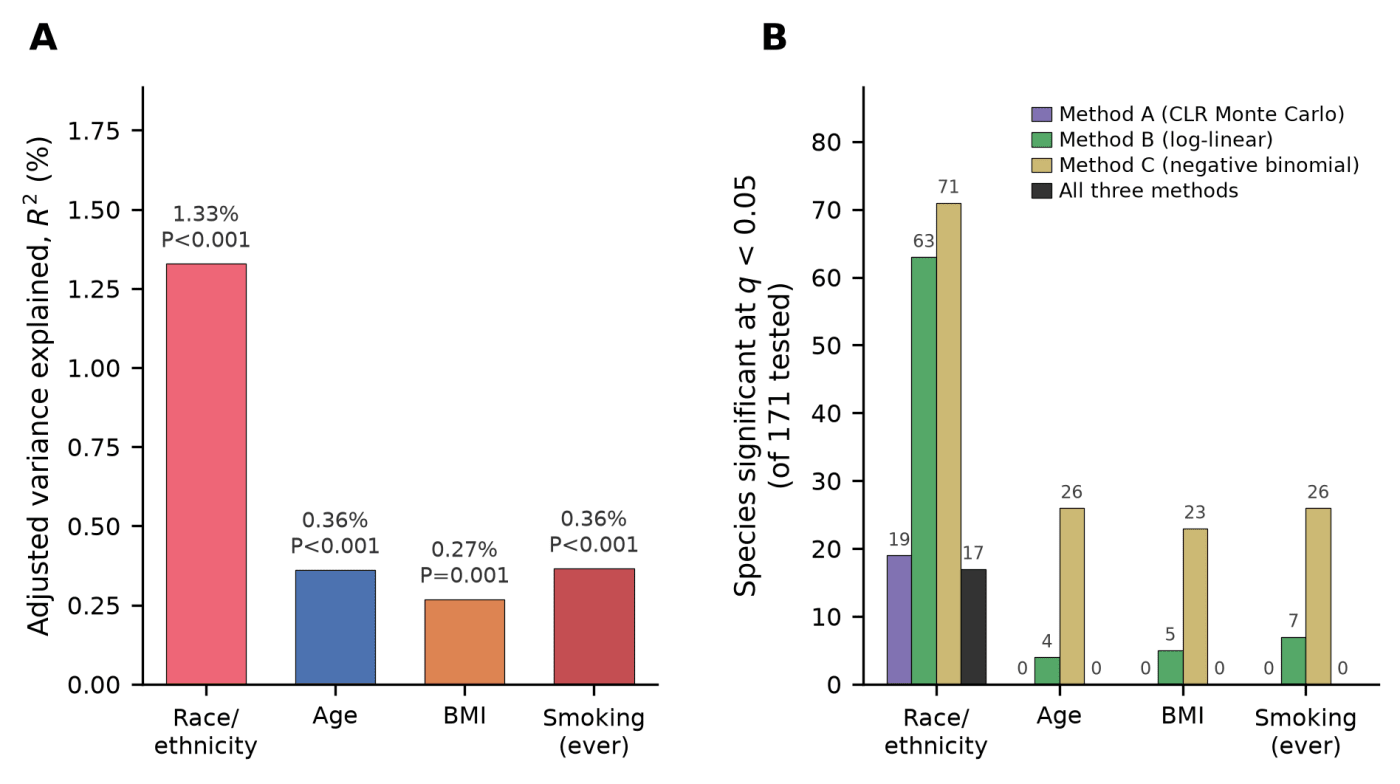
Figure 6. Cross-factor comparison of race/ethnicity, age, BMI, and smoking. (A) Adjusted PERMANOVA R² (%) for each factor. (B) Number of species (of 171 tested) reaching differential-abundance significance (q<0.05) by each of the three independent methods, and the number reaching robust evidence across methods (race/ethnicity: all 3 of 3; age, BMI, smoking: at least 2 of 3).
The race/ethnicity PERMANOVA effect and the B. plebeius carriage odds ratio were stable across seven sensitivity scenarios varying the minimum sequencing-depth threshold (1,000, 2,000, or 5,000 reads), the species-prevalence threshold (5%, 10%, or 20%), the CLR pseudocount (0.5 or 1.0), and the distance metric (Aitchison or Bray-Curtis). Adjusted R² for race/ethnicity ranged narrowly from 1.22% to 1.42% (Aitchison distance) and was 0.96% using Bray-Curtis dissimilarity; all scenarios remained significant at P<0.001. The B. plebeius carriage odds ratio for NH Asian versus NH White ranged from 4.48 to 4.59 across depth and pseudocount variations (all P<0.001), except at the 20% prevalence threshold, where B. plebeius fell below the prevalence cutoff and carriage logistic regression could not be estimated (species retained but not through this specific gate). These results indicate that the primary findings are not artifacts of specific arbitrary analytic choices in filtering or distance metric.
In this cross-sectional analysis of 730 participants from a multi-ethnic US cohort, self-reported race/ethnicity showed the largest independent association with gut microbiome community structure among nine covariates tested, including age, sex, BMI, smoking, physical activity, education, sequencing depth, and stool collection year. This finding is consistent with, and extends, prior reports of gut microbiome differences across US racial/ethnic groups [8,10,11,12,13] by directly comparing the race/ethnicity effect size against several plausible confounders and by using three independent differential-abundance methods together with a permutation-tested classifier, which converged on the same qualitative conclusion: the association is not fully explained by the covariates measured here.
The clearest and most biologically interpretable signal was the higher carriage and abundance of Bacteroides plebeius and Bacteroides coprocola in NH Asian participants. Both species can carry porphyranase/agarase genes acquired by horizontal gene transfer from marine bacteria [14,15], and a large multi-country survey found this porphyran-degradation gene system, and its bacterial carriers, to be markedly enriched in East Asian populations relative to other world regions, most plausibly reflecting long-standing dietary consumption of seaweed such as nori [16]. Because our analysis used a self-reported race/ethnicity category (NH Asian) rather than direct measurement of seaweed or nori intake, and because we adjusted for available covariates but not for detailed diet, the finding here is consistent with, but does not on its own prove, a dietary mechanism; it should be interpreted as an association between a socially defined group label and an organism whose enrichment elsewhere in the literature is attributed to a specific and plausible dietary exposure.
The lower carriage and abundance of Akkermansia muciniphila in NH Asian participants is more difficult to interpret in isolation. In the broader literature, A. muciniphila abundance is most consistently reported to be lower in obesity [17], and the NH Asian group in this cohort had the lowest mean BMI and the lowest obesity prevalence of the four groups (Table 1); a purely obesity-mediated mechanism would therefore predict higher, not lower, A. muciniphila abundance in NH Asian participants. Because our PERMANOVA and differential-abundance models explicitly adjusted for BMI, and the lower A. muciniphila carriage in NH Asian participants persisted after this adjustment, the observed pattern in this cohort runs counter to a simple BMI-mediated explanation and may instead reflect diet composition, gut transit time, or other unmeasured factors that differ by race/ethnicity independent of BMI; we did not have the dietary or transit-time data needed to test these hypotheses directly and flag this as an area for future investigation using this or similar cohorts [2].
The consistently smaller and less robust associations found for age, BMI, and smoking, relative to race/ethnicity, in the same dataset and the same analytic pipeline, argue that the race/ethnicity effect is not an analytic artifact specific to how race/ethnicity happened to be modeled; the same PERMANOVA, differential-abundance, and adjustment procedures applied to age, BMI, and smoking produced measurably weaker signals. This internal comparison strengthens, but does not eliminate, the interpretation that race/ethnicity captures real, unmeasured correlated exposures (most plausibly diet, and potentially additional unmeasured social, immigration-related, or environmental factors [9,5,6,7]) beyond the eight covariates available in this dataset.
Several limitations should be considered when interpreting these results. First, this is a cross-sectional, observational analysis; no causal claims can be made about race/ethnicity, diet, or any specific taxon and any health outcome. Second, race/ethnicity is a social and administrative construct, not a direct biological measurement; any association reported here reflects correlated social, dietary, immigration-history, and environmental exposures that were not individually measured and adjusted for, most importantly detailed diet, which was not available in this dataset despite its established role as a major driver of inter-individual microbiome variation [20]. Third, race/ethnicity and stool-collection year were strongly correlated in this cohort (Cramer's V=0.57) because of the recruitment design; although we explicitly adjusted for collection year in every model and confirmed the race/ethnicity association persisted within single-year strata, residual confounding by unmeasured factors that also differ by recruitment wave cannot be fully excluded. Fourth, statistical power differed substantially across race/ethnicity groups (NH Black n=75 versus NH White n=277 and NH Asian n=250), so null or attenuated findings for the NH Black group, and the comparatively wide confidence intervals for that group in Table 3, may partly reflect limited power rather than a true absence of association; this cohort was not powered to detect small effects in the smallest group. Fifth, this analysis used self-reported race/ethnicity as a four-level categorical variable without genetic ancestry data; no genetic ancestry estimation was performed or is available for this dataset, and the biological interpretation of any taxon-level finding should not be extended to genetic-ancestry claims. Sixth, multiple-testing burden was addressed with Benjamini-Hochberg FDR correction within each differential-abundance method and within the pairwise PERMANOVA contrasts, but the overall number of statistical tests conducted across the full study (nine PERMANOVA terms, three differential-abundance methods across 171 species for four factors, five carriage-logistic models, five alpha-diversity metrics, and seven sensitivity scenarios) was large, and some borderline findings (for example, the BMI-richness trend, P=0.058, and the NH White vs. Hispanic pairwise contrast, q=0.053) should be considered only suggestive. Seventh, the shotgun metagenomic species-level count table used here does not capture strain-level variation, structural variants, or the underlying gene content directly; the porphyranase/agarase gene interpretation relies on prior published work on these species rather than on the direct detection of pathway genes in this specific dataset, and the absence of a detected pathway gene in our processed table cannot be inferred from species absence alone. Eighth, the multinomial classifier's high performance should be interpreted as evidence of a genuine compositional signal distinguishing race/ethnicity groups, but the same recruitment-wave confounding could inflate its accuracy if year-associated batch effects are not perfectly captured by the model; our within-2016-year subset analysis (AUC=0.905) partially, but not completely, addresses this concern. Finally, approximately 57% of participants had zero detected Akkermansia muciniphila reads, and pseudocount-based log-transformation of these zero values (used for visualization and CLR-scale modeling) does not distinguish "true absence" from "present below detection limit," a general limitation of compositional zero-handling in sparse metagenomic data. All reported associations are exploratory, hypothesis-generating, and not validated for any clinical, diagnostic, or predictive use in individual patients.
In this multi-ethnic US cohort, self-reported race/ethnicity was independently associated with overall gut microbiome community structure and with the carriage of specific species, including a marked enrichment of Bacteroides plebeius and Bacteroides coprocola, and a reduction of Akkermansia muciniphila and Alistipes putredinis, among NH Asian participants, after adjustment for age, sex, BMI, smoking, education, physical activity, sequencing depth, and stool collection year. This association was larger and more consistent across independent statistical methods than the associations observed for age, BMI, or smoking status in the same dataset. These findings support the hypothesis that race/ethnicity-correlated exposures, most plausibly diet, contribute measurably to gut microbiome variation in multi-ethnic US populations, and they motivate future studies that directly measure diet, food-frequency data, and genetic ancestry to further disentangle the specific exposures underlying this association. These results are exploratory and should not be used for clinical or diagnostic purposes.