Martin Zillmann
A foundational prerequisite for integrating any analytical tool into biomedical research is a rigorous, quantitative demonstration that the tool produces results that are accurate and reproducible. For agentic AI systems that autonomously plan and execute multi-step analytical pipelines this standard has rarely been met at scale on real-world clinical genomics data. This white paper addresses that gap directly.
We evaluated bystro THiNK, an agentic large language model (LLM)-based research platform, on one of the most cited and methodologically demanding clinical genomics datasets available: the MSK-IMPACT cohort, comprising prospective clinical sequencing data from over 10,000 patients with advanced solid cancers [1]. Using only natural-language prompts and multi-format tabular source files, bystro THiNK independently reproduced the core analyses that originally required a large team of specialized collaborators to produce [1].
The primary finding is unambiguous: master data tables produced by bystro THiNK and by an experienced human analyst working with conventional tools were 104,705 rows in length and 100% identical in content (95% confidence interval: 99.9965% to 100%, Clopper-Pearson exact method). Under the rule of three, this result places a 95% upper bound of 0.003% — equivalent to no more than 29 errors per million data rows — on the true undetected error rate. Figures produced by both approaches were visually and numerically equivalent outside of minor stylistic formatting choices.
These results constitute strong evidence that bystro THiNK is capable of performing complex, multi-file clinical data aggregation and visualization at a level of accuracy that is indistinguishable from experienced manual analysis. This finding is directly relevant to researchers, clinical bioinformaticians, and institutions seeking quantitative justification for incorporating agentic AI into research workflows, not as a replacement for domain expertise, but as a rigorous, auditable, and high-throughput analytical partner.
Clinical genomics research has grown in scale, complexity, and consequence at a pace that challenges conventional analytical workflows. Studies such as the MSK-IMPACT initiative, which produced tumor and matched-normal sequencing data from more than 10,000 patients across 62 principal cancer types, illustrate both the promise and the operational burden of large-scale precision oncology [1]. The original MSK-IMPACT assay, which interrogates all protein-coding exons of 341-410 key cancer-related genes using hybridization capture-based next-generation sequencing [7], was developed specifically to translate genomic complexity into clinically actionable information at institutional scale.
The analytical challenge does not end at sequencing. Extracting research-grade conclusions from datasets of this magnitude requires aggregating results across multiple heterogeneous files using sample or patient identifiers as keys, analyzing overall data quality (completeness, consistency, omissions, duplications, etc.), performing multi-dimensional summaries, creating publication-quality figures, and doing so with a degree of rigor sufficient for peer review. The 2017 MSK-IMPACT Nature Medicine publication, which has accrued more than 2,000 citations, involving approximately 100 authors across clinical, computational, pathological, and regulatory specialties, is a testament to the human resources that this type of work demands [1].
Recent years have seen substantial progress in the deployment of LLMs and agentic AI systems for biomedical research tasks. In functional genomics, LLMs have been shown to identify common gene-set functions with higher specificity than classical enrichment methods [13], and self-verifying agentic architectures have been shown to consistently outperform standalone GPT-4 on gene-set annotation tasks across more than 1,100 gene sets [14]. In clinical oncology, LLM-based pipelines have achieved greater than 90% recall on clinical trial eligibility screening [10], and a real-world multimodal pipeline demonstrated 93% criterion-level accuracy on a public benchmark and 87% accuracy across 485 patients at 30 clinical sites [11].
These results are encouraging, but they evaluate LLMs primarily as isolated reasoning or retrieval engines. Agentic AI systems that orchestrate multi-step tool use, data loading, computation, and output generation have received comparatively less rigorous validation, particularly on complex, multi-file research workflows where errors can accumulate across many pipeline stages.
Despite the progress described above, skepticism among research scientists remains substantial and is well-founded. Surveys conducted between 2023 and 2025 indicate that between 30% [2] and 63% [3] of scientists report having used generative AI tools in their research, but regular, routine use is far less common — often under 7% even in the highest-adoption samples [3]. A majority of researchers express concern about AI-introduced inaccuracies: in one representative survey, 68% worried about misinformation, 68% about plagiarism facilitation, and 66% about the introduction of errors into research papers [4].
These concerns are not without precedent. Studies evaluating LLM performance on reference retrieval have found hallucinated citations at rates exceeding 25% [5]. Even for best-in-class models, clinically significant error rates have been documented in standardized oncology knowledge assessments [12]. A recent systematic study of agentic AI on multi-omic single-cell datasets found that agents excel at well-defined computational pipelines but falter at open-ended synthesis tasks requiring cross-domain domain expertise [6].
The empirical literature thus presents a nuanced picture: agentic AI systems can perform reliably on structured, well-defined analytical tasks, but their accuracy in complex, open-ended research contexts remains variable and context-dependent. The critical question largely unanswered in the published literature is whether agentic AI can perform at human-level accuracy on the full lifecycle of a complex real-world research analysis pipeline that spans multi-format data ingestion, multi-level aggregation, statistical summarization, and figure generation.
This white paper addresses a specific, testable question: Can bystro THiNK, operating solely through natural-language prompts, accurately reproduce the core analysis of a complex, published, multi-format clinical genomics dataset as measured against an independently produced manual analysis using only conventional tools?
This question is distinct from, and in several respects, more demanding than the questions addressed in existing validation studies. Rather than evaluating performance against a curated benchmark with predefined inputs and labeled outputs (as in most NLP benchmarks), we evaluate performance against a complete published research analysis. The source data exist across multiple files, in varying formats, and require domain knowledge to correctly integrate; the analytical targets are not single questions but entire summary tables and multi-panel figures. Error accumulation across pipeline stages is possible at every step.
The specific benchmark was selected because the MSK-IMPACT 2017 dataset and its associated figures in Nature Medicine [1] represent an independently peer-reviewed, highly-scrutinized ground truth. The analyses embedded in that manuscript are not simplifications: they represent the real-world output of a 100-person scientific team working over multiple years.
For research scientists, the stakes of this question are concrete. Large collaborative studies routinely involve data transfers across teams, format conversions, and iterative re-analyses — each of which introduces the possibility of transcription, coding, or calculation errors. AI systems that can perform these integrations with verifiable accuracy could meaningfully reduce the error surface in modern research pipelines, not by replacing expert judgment, but by providing a reliable, collaborative, auditable computational layer.
Clinical genomics trials of the scale represented by MSK-IMPACT require cross-functional teams encompassing principal investigators, clinical coordinators, molecular pathologists, regulatory specialists, bioinformaticians, and biostatisticians. The 2017 MSK-IMPACT Nature Medicine publication carries approximately 100 authors, illustrating the magnitude of specialized human effort that large-scale precision oncology studies require [1]. Data aggregation across institutions, laboratories, and time points creates numerous opportunities for manual transcription errors, even under dual-entry data practices and rigorous quality review.
Computational pipelines address some of these challenges by standardizing certain steps including alignment, variant calling, and quality scoring, but the translation of processed genomic and clinical data into research-ready summary tables and publication figures often remains a largely manual task, performed by small numbers of analysts who must apply domain-specific interpretations that are difficult to fully specify in advance.
The accumulated evidence identifies several categories of limitation in current AI systems relevant to clinical research:
Content generation accuracy: For high-stakes tasks such as automated manuscript writing, hypothesis generation, and grant proposal drafting, a majority of surveyed users rate AI outputs poor or fair [3].
Hallucination: LLMs continue to generate plausible but incorrect factual statements, including fabricated literature citations at rates exceeding 25% in some studies [5], and incorrect gene function assertions that require systematic domain verification [14].
Structured data accuracy: Accuracy on structured data extraction and interpretation benchmarks varies widely, from approximately 50% to 93%, depending on task design, model, and augmentation strategy [10, 11, 12].
Complex synthesis: Using appropriate statistical tools to draw novel, cross-domain biological conclusions from heterogeneous multi-omic datasets remains the most demanding frontier beyond current agentic capabilities without substantial human oversight [6].
These limitations reinforce the importance of scoping AI use to well-defined, verifiable tasks within broader human-supervised pipelines, rather than treating agentic AI as an autonomous analytical authority.
A critical gap exists in the current literature: while LLMs have been evaluated on many component tasks (trial matching, question answering, gene-set annotation), no published study has evaluated whether an agentic AI system can reproduce the complete analysis of a large, multi-file, real-world clinical genomics dataset from raw data ingestion through figure generation at a quantitative concordance level sufficient for research use. That is the gap this white paper addresses.
Data
All genomic results and associated clinical data for patients in this study are publicly available in the cBioPortal for Cancer Genomics at the following URL: https://www.cbioportal.org/study/summary?id=msk_impact_2017. Four source files from the data set were aggregated and analyzed: (1) data_clinical_sample.txt, (2) data_mutations.txt, (3) data_cna.txt and (4) data_sv.txt.
Exclusion of Patients Associated with Multiple Cancer Types from Manual and bystro THiNK Master Data Tables
30 patients with multiple associated cancer types and 65 associated samples were excluded from analysis in this work (Appendix, Table 2) to avoid computational ambiguity when cancer types are aggregated at the patient level—i.e. the patient has multiple samples with different cancer types, but it was ambiguous which cancer type sample should be counted, and which should be dropped or ignored.
Manual Creation of a Master Data Table
The four source files (see Data) were aggregated step-wise into a master data table using Excel. Each of the alteration files (MUT, SV, and CNA) were transformed into a table with 3 columns: SAMPLE_ID, GENE, and ALTERATION. Because the SV file contained two genes involved in the event, both were retained by adding additional rows and retaining associated PATIENT_ID and ALTERATION information. For the CNA file, only SAMPLE_ID - GENE combinations with a score of 2 or -2 were retained. The MUT, CAN, and SV tables were appended, and the alterations were re-coded to match the alteration classes used by the authors for manuscript Figure 2c (Appendix, Table 3). The clinical sample data was then merged in using SAMPLE_ID as the joining key, followed by removal of rows containing PATIENT_IDs from the list of excluded patients (Appendix, Table 2). Summary statistics for the manual master data table are provided below (Appendix, Table 1).
Creation of a Master Data Table Using bystro THiNK
A workflow similar to the manual workflow was used while creating the master data table with bystro THiNK. The MSK source files were uploaded into bystro THiNK and it was instructed using a natural language prompt on how the data should be processed to a CSV file output. Appending of the MUT, CAN, and SV tables, merging of the clinical data, re-mapping of ALTERATION values, and removal of rows associated with the excluded patients were performed similarly. Summary statistics for the bystro THiNK-generated master data table are provided below (Appendix, Table 1).
Example prompts with various primary or intermediate data uploaded are below:
"Please create a new table with the following columns from the attached file in the order Tumor_Sample_Barcode, Hugo_Symbol, Variant_Classification. Then create a CSV output file with the columns renamed SAMPLE_ID, GENE, and ALTERATION."
"Please create a single master data table from all of the data_clinical_sample.txt files for the fields: PATIENT_ID, SAMPLE_ID, CANCER_TYPE, MSI_SCORE_MANTIS, MSI_SENSOR_SCORE, and TMB_NONSYNONYMOUS."
Generation of Summary Statistics for the MSK-IMPACT Data Set
To generate the analysis presented in the Appendix, Table 1, the text format primary tables were opened in Excel and analyzed using various native filters and formulas.
Manual Replication of Manuscript Figures
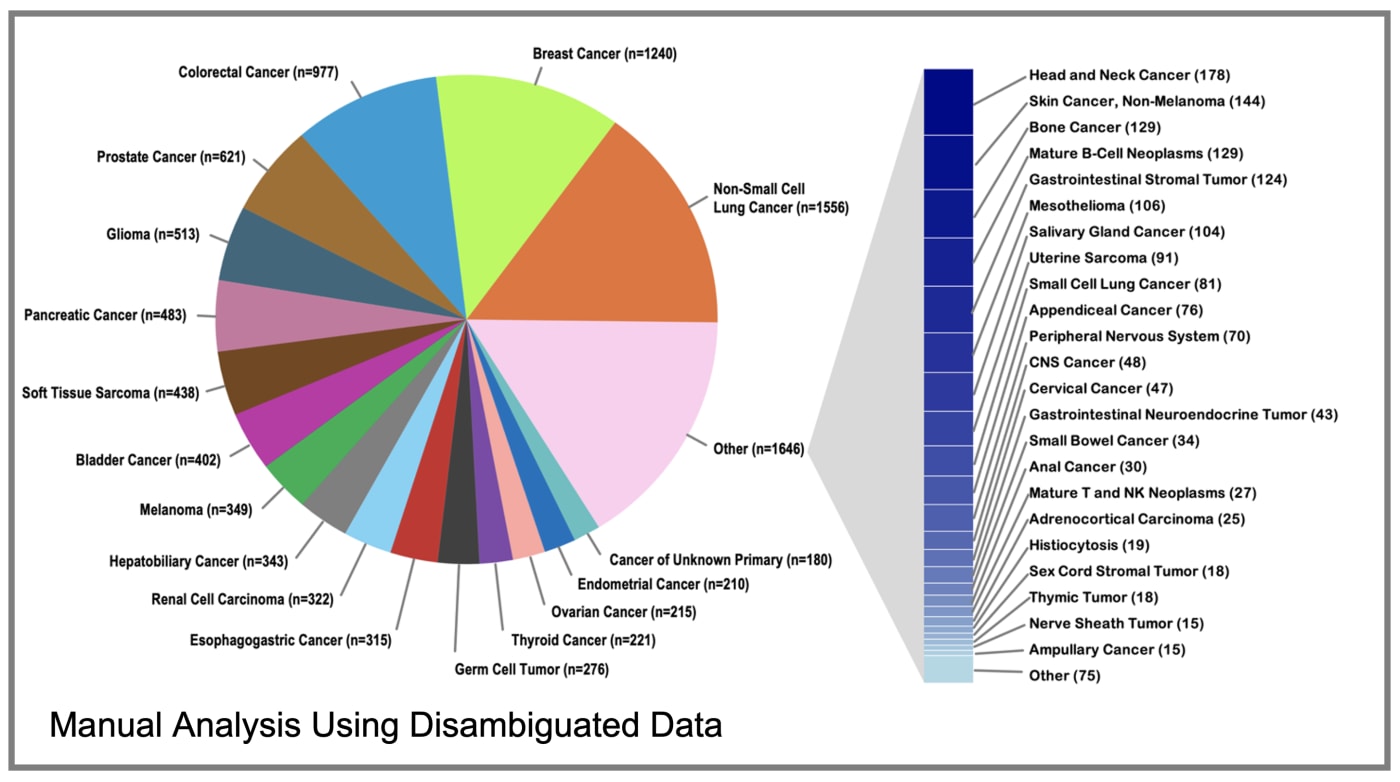
The manually created master data table was used as the source for all figures. Only cancer type and gene name labels appearing in the TCGA source files were used. Charts were all created using Microsoft Excel, the only exception being the violin plot in replicated Figure 2c which was created using the pandas, matplotlib, and seaborn libraries in python. Effort was made to make the figures visually similar (colors, layout, data labels) to the original figures to facilitate comparison.
bystro THiNK Replication of Manuscript Figures
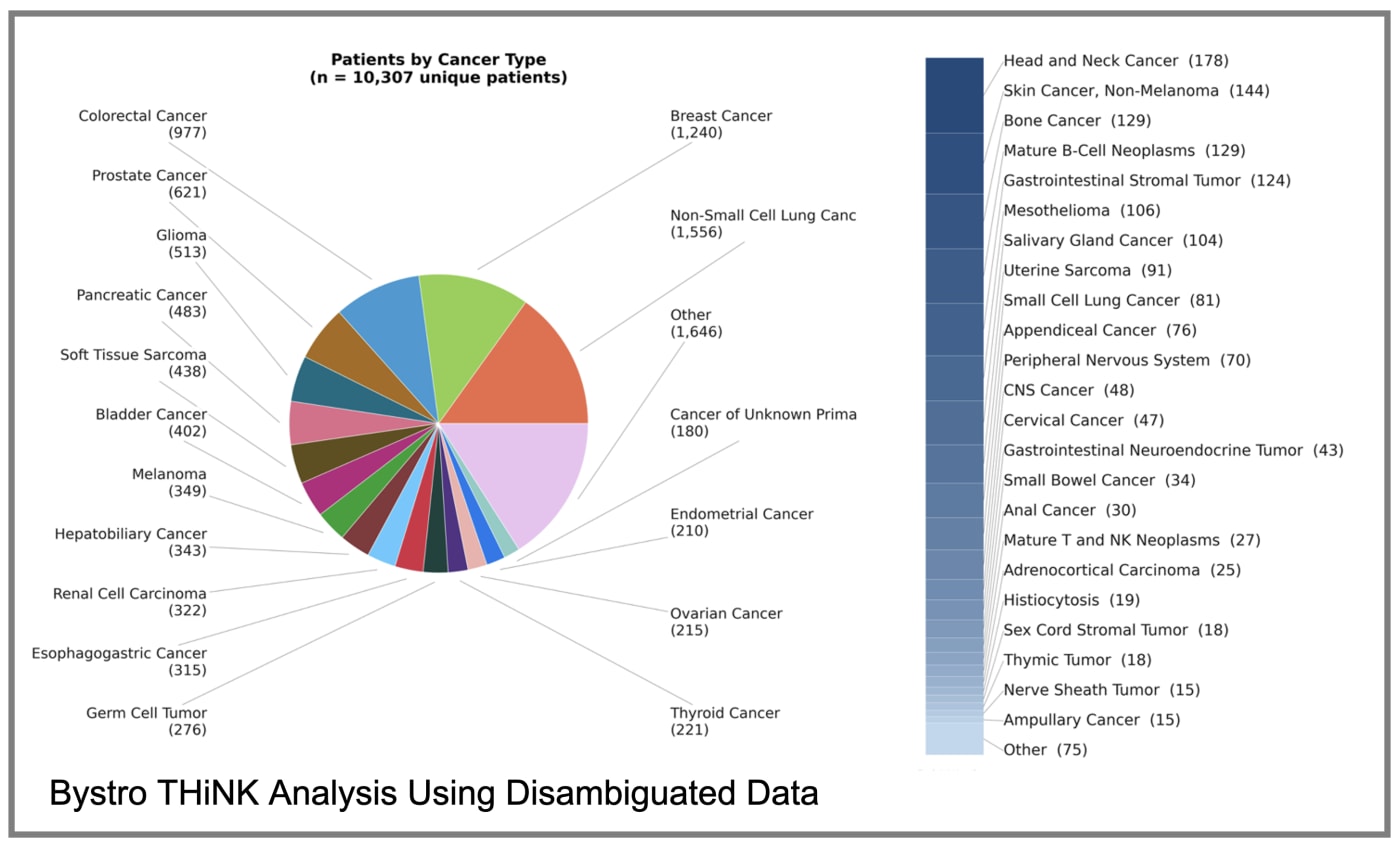
The master data table created by bystro THiNK was used for the creation of figures. The individual manuscript figures were not used as inputs. Only cancer type and gene name labels appearing in the TCGA source files were used. For complex, multi-panel figures (e.g. the pie chart and single stacked bar graph representations of patient counts by cancer type) were created individually and assembled manually into the final image. The master data table was uploaded to bystro THiNK and a series of plain language prompts was used to create the charts. To arrive at the color scheme used by the authors, a table of data series names and html color values was uploaded and bystro THiNK was prompted to recolor the plots according to this scheme. Effort was made to make the figures visually similar (colors, layout, data labels) to the original figures to facilitate comparison.
Example prompts with various primary or intermediate data uploaded are below:
"Using the attached clinical data, please create a pie chart that shows the number of patients with each cancer type and an "Other" category that contains all cancers with affected patient counts less than 180. Patients with multiple samples should be de-duplicated. Pie sections should be labelled outside of the section with cancer type and the count in parentheses. Please order the pie sections in order of decreasing counts in a counterclockwise direction and place the boundary between the adjacent "Other" and "Non-Small Cell Lung Cancer" categories at the 3 o'clock position."
"Please convert the gene_cancer_frequency_filtered table to a heatmap where the minimum value has the rgb color (255,255,255) and the maximum value has the rgb color (38,29,17)."
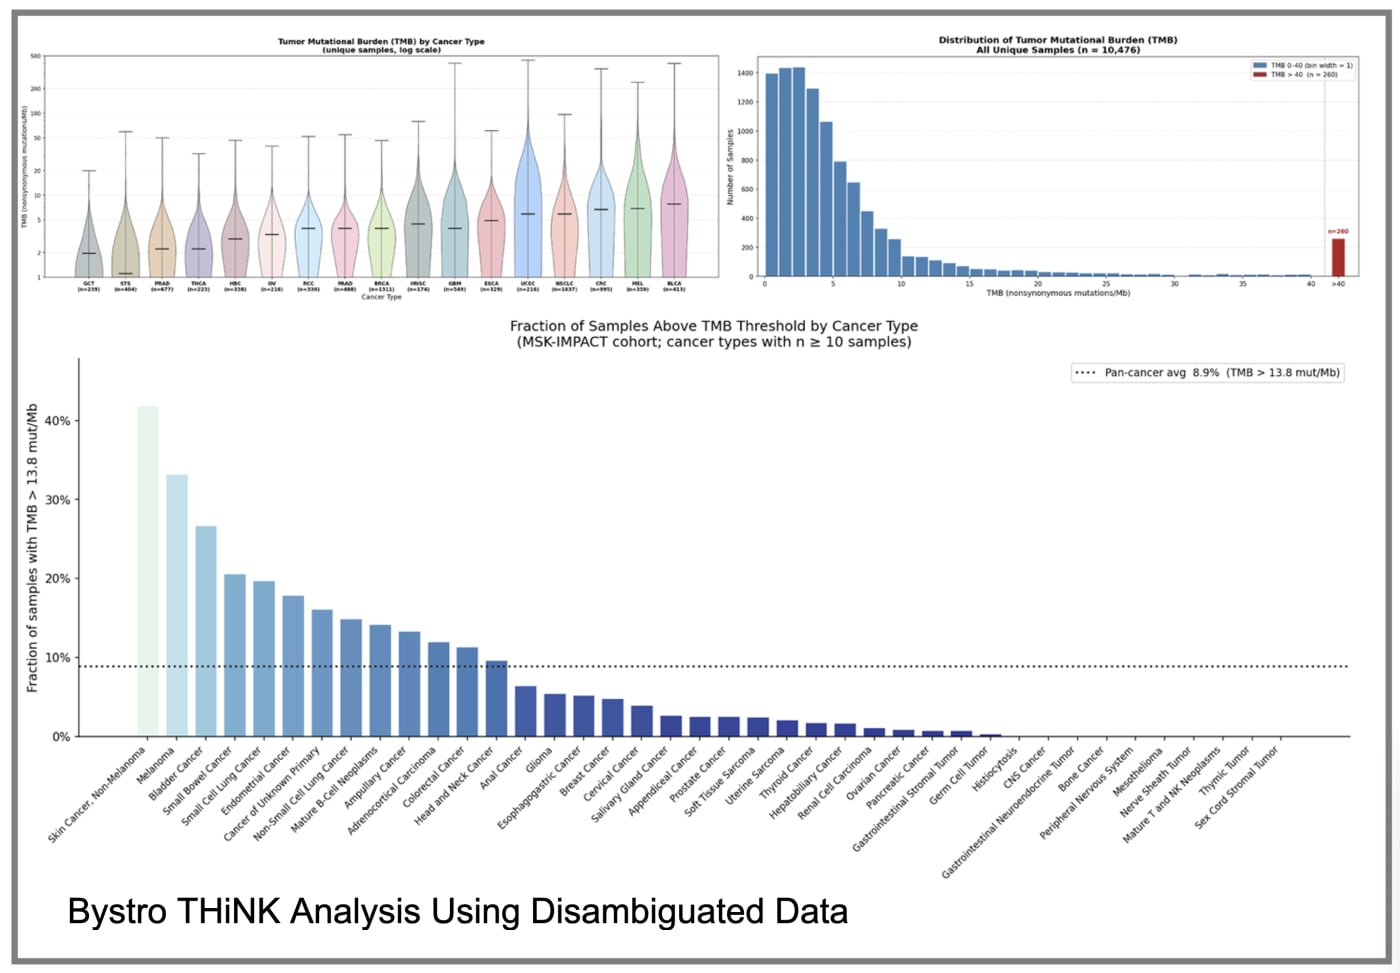
"For the cancers in the attached CANCER_LIST file, create a violin plot showing the distribution of TMB values using the data for unique sample IDs from the master_data_table_with_clinical_FjKEFrQy file. Transform the y-axis to log scale between 1 and 500. Series labels on the x-axis should be in the same order as in the cancer_list file. Also create a frequency histogram using all TMB scores for unique samples, capping the x-axis at TMB>40, creating an additional >40 bin."
Analysis of cBioPortal MSK-IMPACT Data Set
The MSK-IMPACT data set contains a total of 77 files containing 63.4 Mb of data. Details, as reported by bystro THiNK and verified manually are shown in Table 1 below. The files are generally tabular in nature, but do not adhere to a single convention—i.e. the table containing CNV data is a wide matrix whereas the others are generally long matrices. The data_*.txt files, in aggregate, contain over 12 million data points.
| CATEGORY | FILES | TOTAL SIZE | NUM VALUES | DESCRIPTION |
|---|---|---|---|---|
| case_*.txt, cases_*.txt | 60 | 1.20 Mb | - | Per-cancer-type and aggregate sample ID lists |
| data_*.txt, data_*.seq | 7 | 62.2 Mb | 12,223,885 | Primary genomic and clinical data tables |
| meta_*.txt | 8 | < 0.01 Mb | - | cBioPortal dataset configuration descriptors |
| Readme.txt | 1 | < 0.01 Mb | - | Reference to gene panel definitions |
| License | 1 | < 0.01 Mb | - | Study license |
Overall Data Concordance
The data used for analysis in the 2017 MSK Nature Genetics Manuscript as deposited in cBioPortal and the data used here should be identical. However, 30 patients with multiple associated cancer types were excluded from analysis in this work because it is unclear to which cancer type they should be assigned, but this exclusion causes less than a 1% change in any database statistic (Appendix, Table 1) and should not cause perceptible changes in summary figures outside of numeric legend entries.
Data Inconsistencies Identified in the 2017 MSK Nature Genetics Manuscript
It is in no way the intention of the author to erode the value of the findings of 2017 MSK Nature Genetics Manuscript, rather, it is the intent of the author to demonstrate the utility of bystro THiNK for the accurate analysis of complex data sets and the identification of internal data set discrepancies. During the course of this analysis, various discrepancies were identified. Multiple explanations for these discrepancies exist: (1) the sample data used in the final manuscript and the sample data deposited in cBioPortal may not be identical, (2) various re-codings of cancer types may have been applied that this author has no visibility to, (3) assumptions about inclusion or exclusion of certain data in summary statistics (e.g. TMB or CNA scores of 0), etc. This work is based on the available data taken at face value, making as few re-coding (e.g. Biliary Cancer = Hepatobiliary Cancer) and re-mapping (e.g. CNA value of 2 = Amplification, CNA value of -2 = Deletion) assumptions as possible.
Different primary cancer types within a single patient occur infrequently and are referred to as synchronous multiple primary malignancies (MPMs), but cancer type counts at the patient level as enumerated in Figure 2a sum to 10366, the number of patients in the study. If multiple cancer types for such individuals were counted separately, the cancer type counts would sum to a number larger than 10366. Patients assigned multiple cancer types are listed in the Appendix, Table 2.
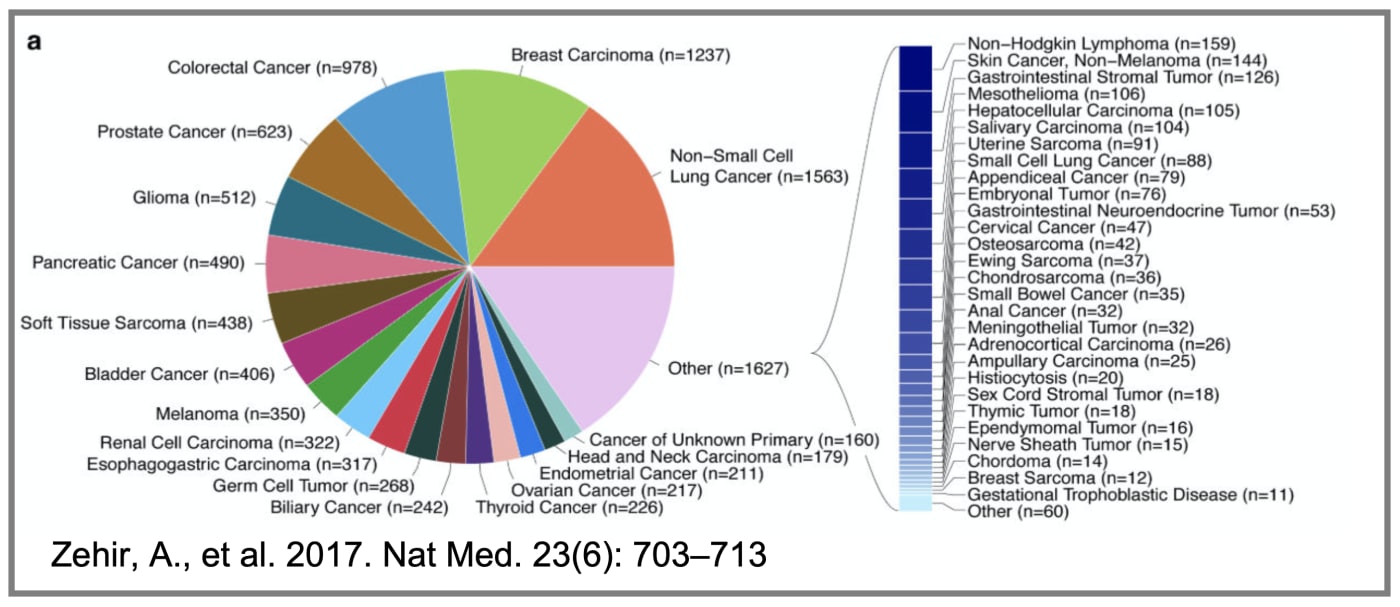
159 versus 5. Figure 2a in the 2017 Nature Genetics manuscript shows 159 patients with Non-Hodgkin Lymphoma (at the top of the expanded view of the pie charts "Other" section), while manual and bystro THiNK analysis show 5, in concordance with the value available in the Cancer Type summary table for the study on cBioPortal. Manual analysis of the data_clinical_sample.txt data file using the CANCER_TYPE field value "Non-Hodgkin Lymphoma" returns only 5 samples (P-0004464-T01-IM5, P-0005451-T01-IM5, P-0006223-T02-IM5, P-0006375-T01-IM5, P-0010489-T01-IM5). This is the number in both manual and bystro THiNK-generated master data tables but is not visible in the patient-level cancer type summary chart because the counts for Non-Hodgkin Lymphoma are lumped with other patient counts below 11 in the study.
Cancer type is available in the CANCER_TYPE column of the data_clinical_sample.txt data file. There are 58 unique cancer types listed in this field for the study. Hepatocellular Carcinoma, Ewing Sarcoma, Chondrosarcoma, Meningothelial Tumor, Epenymomal Tumor, Chondroma, and Breast Sarcoma are present in Figure 2a from the manuscript but absent from the CANCER_TYPE field. Only values present in the CANCER_TYPE field were used for the manual and bystro THiNK analysis.
Hepatocellular Carcinoma appears in the cancer types in the legend of the gene mutation frequency heatmap of manuscript Figure 2 but is not listed as one of the 58 unique cancer types in primary data. Similarly, Biliary Cancer in the figure is Hepatobiliary Cancer in the CANCER_TYPE field and Osteosarcoma in the figure is Bone Cancer in the CANCER_TYPE field.
Cancer type is available in the CANCER_TYPE column and detailed cancer type is available in the CANCER_TYPE_DETAILED column of the data_clinical_sample.txt data file. For the 10366 patients in this file, there are 58 unique values in the CANCER_TYPE field and 359 unique detailed cancer type values in the DETAILED_CANCER_TYPE field by manual inspection of the file. The corresponding values in the manuscript are 62 and 361, respectively, in concordance with the values from study-associated data tables available on cBioPortal.
Replication of Selected Figures: Manuscript Figure 2a
Manuscript Figure 2a offers a high-level overview of the cancer types observed in the study population. The figure caption from the manuscript reads "Distribution of tumor types among cases successfully sequenced from 10,336 patients. Cases represented 62 principal tumor types encapsulating 361 detailed tumor types."
Manual and bystro THiNK analysis of the study's data_clinical_sample.txt file modified to exclude 30 patients with conflicting cancer type codes were 100% identical, but had, as expected, minor differences with the manuscript values.
Some notable differences between the original figure and the bystro THiNK and manual analyses:
Counts for Non-Hodgkin Lymphoma differed drastically: 159 patients in the original paper and 5 patients (collapsed in the Other (75) category) for manual and bystro THiNK analysis.
Other notable count discrepancies between the counts provided in the manuscript figure and manual counts derived from the raw data_clinical_sample.txt file downloaded from cBioPortal are tabulated in the Appendix, Table 4.
Hepatocellular Carcinoma, Ewing Sarcoma, Chondrosarcoma, Meningothelial Tumor, Epenymomal Tumor, Chondroma, and Breast Sarcoma are present in Figure 2a from the manuscript but absent from the CANCER_TYPE field, hence absent from figures generated manually or by bystro THiNK.
Replication of Selected Figures: Manuscript Figure 2c
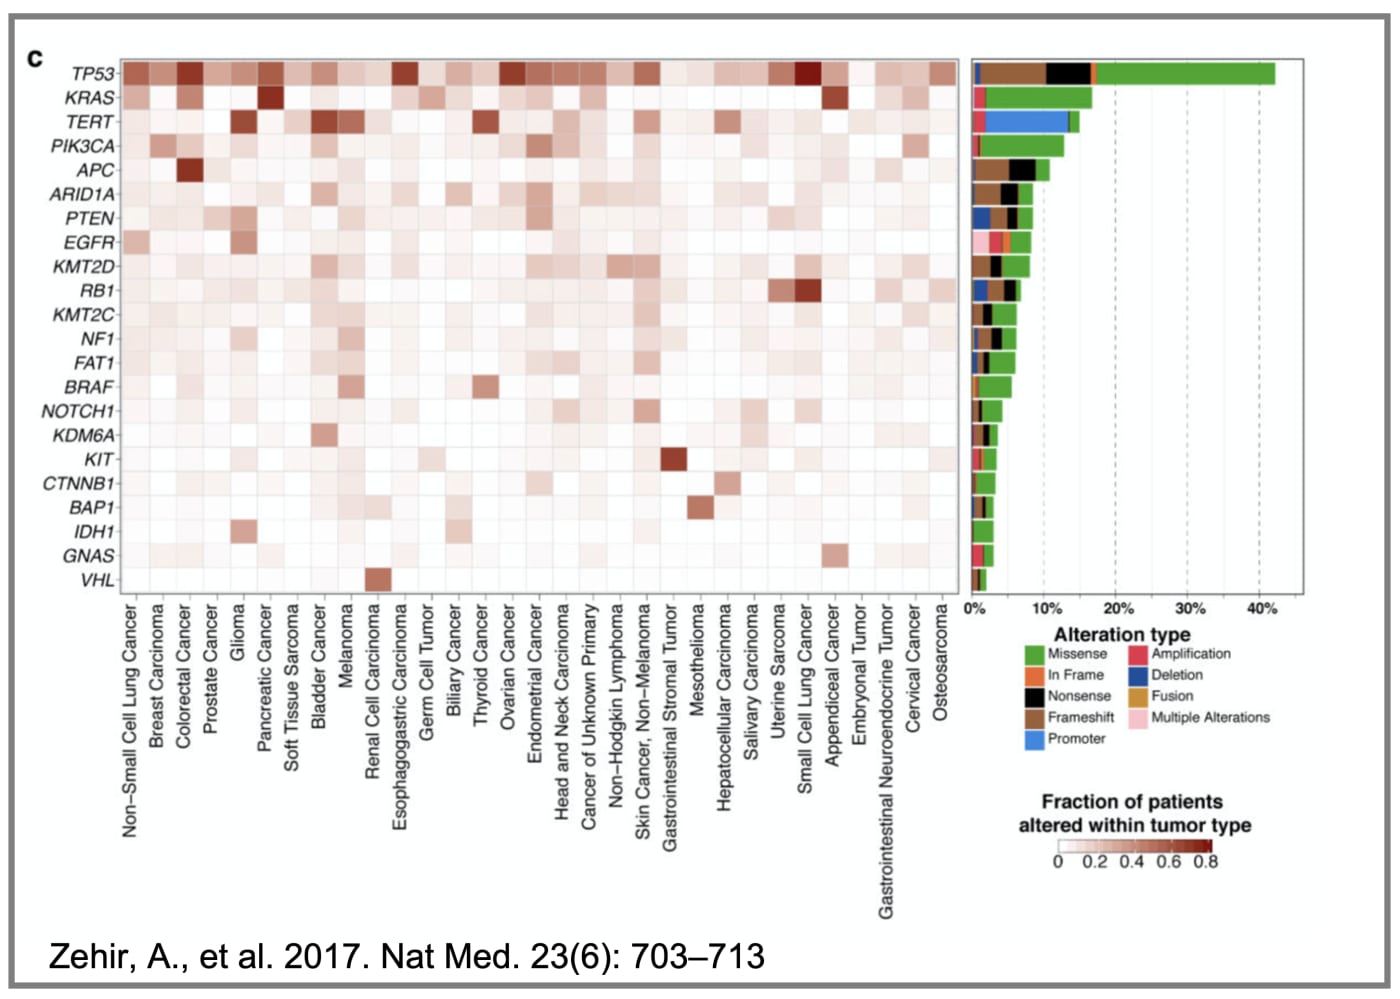
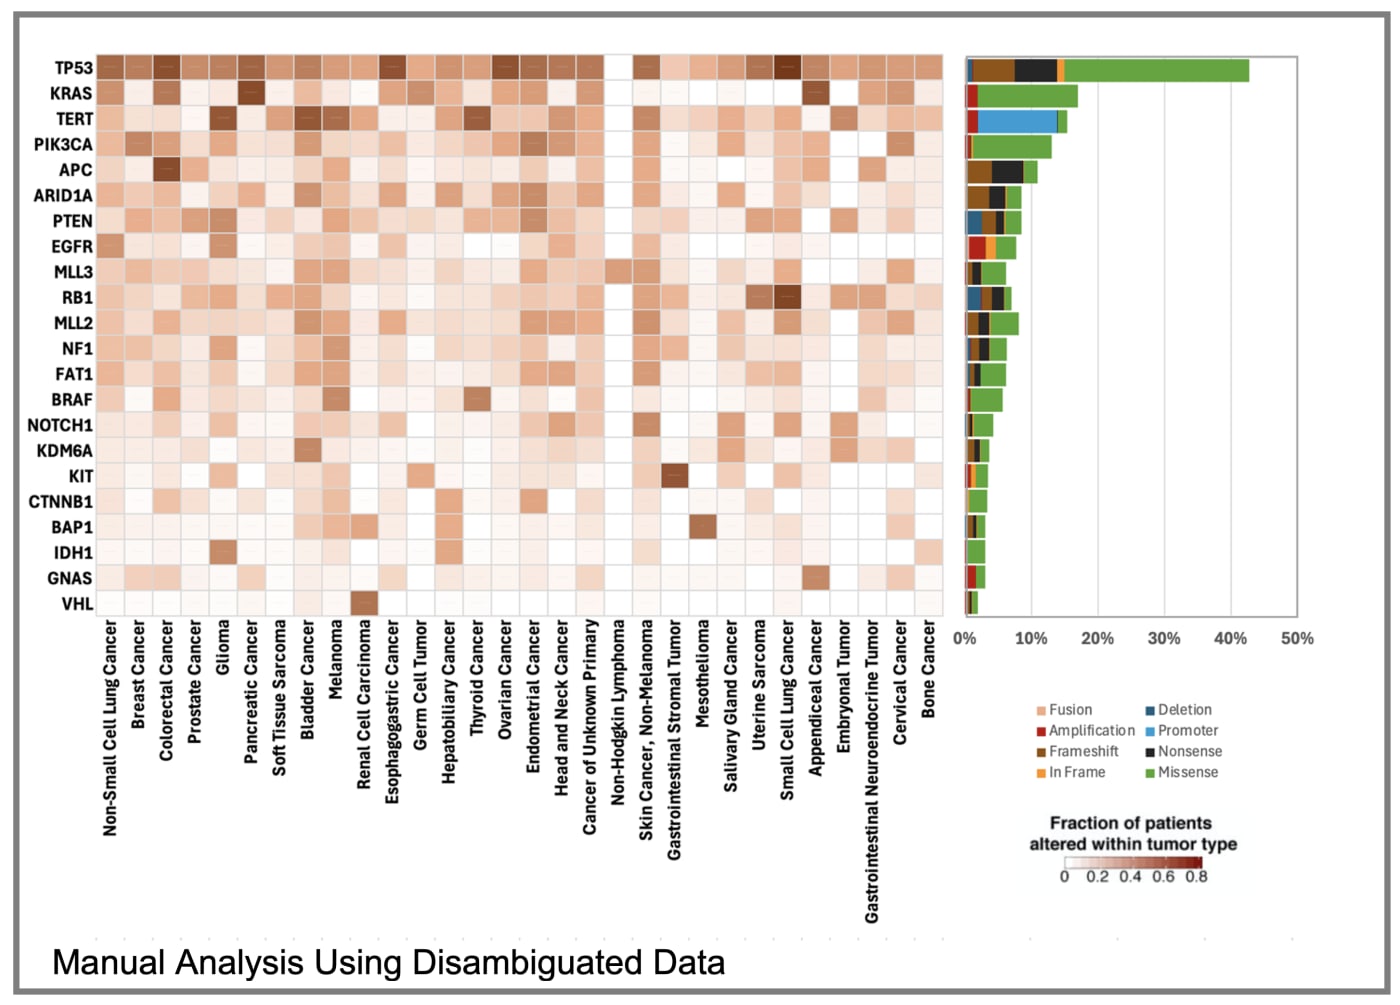
Manuscript Figure 2c is a representation of the genes altered in various cancers based on mutational data. The figure caption from the manuscript reads "Recurrent somatic alterations across common tumor types. Genes with a cohort-level alteration frequency of ≥5% or a tumor type-specific alteration frequency of ≥30% are displayed. Bars indicate the percent of cases within each tumor type harboring different classes of genomic alterations."
Given that the difference between the manuscript data and mutational data for manual and bystro THiNK analysis differ by less than 1% (appendix, Table 1), the three figures below should appear virtually identical.
There are, however, some notable differences between the original figure and the bystro THiNK and manual analyses:
The data series labeled "Hepatocellular Carcinoma" in the heatmap does not appear in the CANCER_TYPE field in primary data and is not present in either manual or bystro THiNK generated figures.
It was also not clear from manuscript text or the figure legend exactly what the "Multiple Alterations" category in the "Alteration Type" graph legend represents, so it is also absent from the replicated figures.

Replication of Selected Figures: Manuscript 5a and 5b
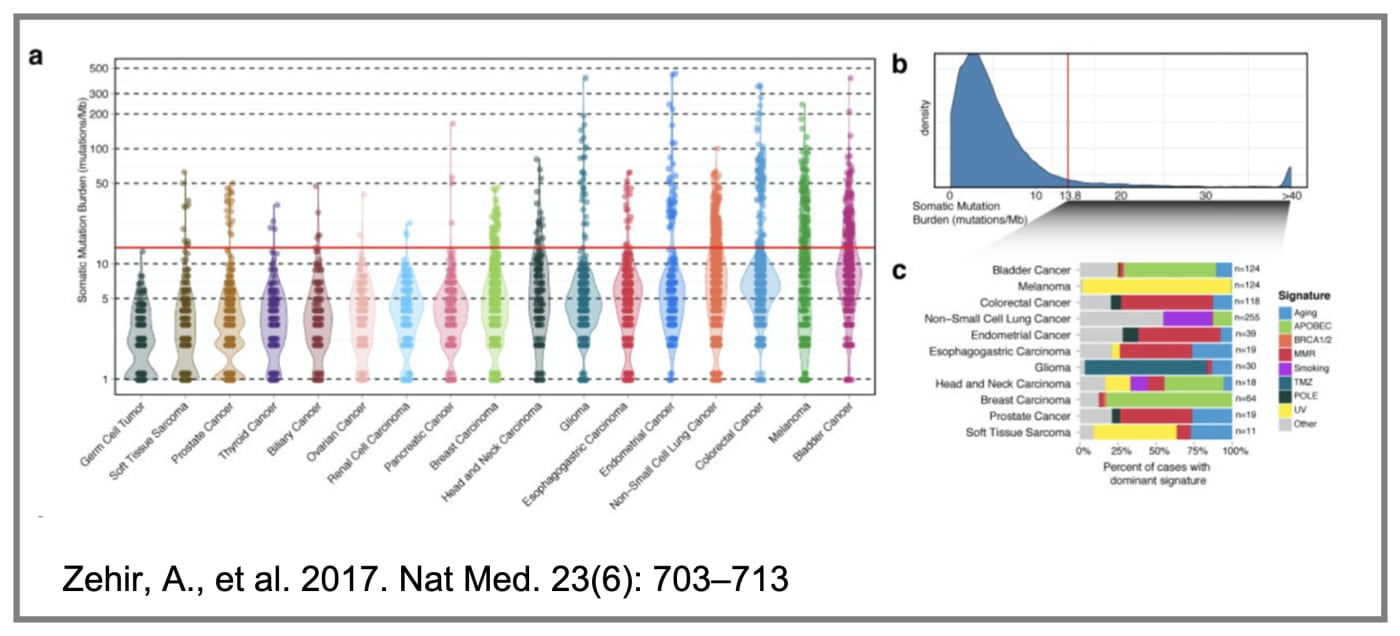
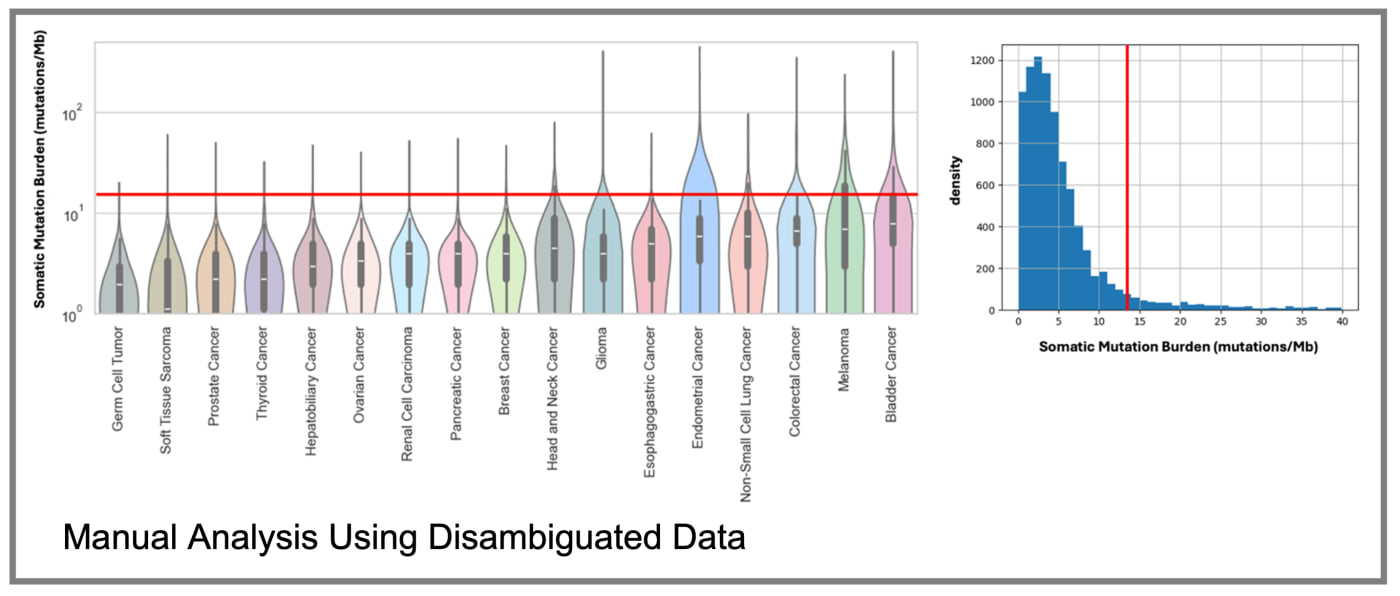
Manuscript Figure 5a is a violin plot representation of the total non-synonymous mutational burden (TMB as non-synonymous mutations per 1 Mbp) for samples of various cancer types. The manuscript caption for the figure reads "Distribution of the somatic tumor mutation burden (TMB), defined as non-synonymous coding mutations per Megabase, for common principal tumor types". Versions of Figure 5a are visually similar across the original and replicates, although the exact format of the plot differs.
Manuscript Figure 5b is the TMB distribution across all samples in the data set. The manuscript caption for the figure reads "Distribution of observed mutation rates across all tumors sequenced was used to identify a threshold of 13.8 mutations/Mb, indicative of high mutation burden". Versions of Figure 5a are visually similar across the original and replicates. The figure replicate created by bystro THiNK also contains a justification for the TMB threshold of 13.8 derived by the authors—TMB median + 2 * IQR = 3.91 + 2 * (6.85-1.96) = 13.7. Using this threshold, 902 samples or 8.9% of samples are above this threshold, most notably Skin Cancer-Non Melanoma, Melanoma, and Bladder Cancer have a high fraction of samples above the TMB threshold and 10 cancer types have zero samples above the threshold (e.g., CNS Cancer, Mesothelioma, Bone Cancer), reflecting inherently low mutational burdens in those tumor types.
Figure 5c was not attempted because it integrates external analysis related to signature classes.
The 100% row-level concordance observed here across 104,705 rows of real-world clinical genomics data, compares favorably with, and in most cases substantially exceeds, previously published benchmarks for AI-assisted biomedical analysis.
In clinical trial matching, where the task is more constrained and the data are less complex, leading LLM-based pipelines have reported criterion-level accuracies of 87–93% on real-world datasets [10, 11]. For tumor board decision concordance, early ChatGPT studies reported case-level agreement of approximately 70% [9]. For oncology question-answering benchmarks, even the highest-performing frontier models were found to have clinically significant error rates [12]. For cancer variant classification from structured panel data, top LLM accuracy on FoundationOne-derived variants reached approximately 73% without retrieval augmentation [16].
These comparisons are not meant to diminish prior work — each study addresses a different and often more cognitively demanding task, and generating open-ended clinical recommendations is substantively harder than reproducing a deterministic data aggregation. The comparison does, however, highlight that bystro THiNK's performance on a fully specified, computationally deterministic task involving data ingestion, merging, aggregation, and figure generation is qualitatively and quantitatively different from the variable performance typical of open-ended LLM reasoning.
This distinction carries an important practical implication: for the class of tasks evaluated here, agentic AI is not introducing additional uncertainty. It is performing, with measurable confidence, a set of operations that are within the design envelope of structured agentic pipeline execution.
The validation paradigm used here — reproducing a published peer-reviewed analysis from publicly available source data — offers several advantages over purpose-built benchmarks. First, the ground truth (the manually produced analysis) was generated independently and without reference to bystro THiNK, eliminating the possibility of circular validation. Second, the task is fully naturalistic: it involves the same file formats, data quality issues, and domain conventions that a researcher would encounter in practice. Third, the benchmark is externally anchored to a peer-reviewed publication, meaning that any divergence between the AI output and the manual output is directly interpretable in terms of research-grade accuracy requirements.
This paradigm also avoids a common limitation of clinical AI benchmarks: performance on curated, cleaned synthetic datasets that may not reflect the variability and complexity of real-world data. The MSK-IMPACT cBioPortal dataset is, to the authors' knowledge, among the largest and most methodologically demanding benchmarks used in any published validation of an agentic AI system for biomedical data analysis.
These results suggest three specific roles in which bystro THiNK may deliver measurable value within research teams:
Supervisory quality control. In large collaborative studies, independently reproducing key summary tables and figures provides an automated audit of the primary analysis pipeline. Any discrepancy between the primary analyst's output and bystro THiNK's output would immediately flag a potential error for human review. This does not require that bystro THiNK be "trusted" blindly; rather, it functions as a second analytical read that complements, rather than replaces, the primary analyst.
Impartial re-analysis. Human analysts, even when operating in good faith, may apply implicit domain-specific decisions differently across subgroups or time points in a dataset. Because bystro THiNK applies analytical instructions uniformly and reproducibly, it is not subject to these sources of inadvertent inconsistency.
Efficiency and accessibility. The ability to execute complex multi-file analyses through natural-language instructions substantially reduces the time required to generate and iterate on research summaries, and makes sophisticated analyses accessible to researchers who may lack deep bioinformatics programming expertise.
The findings of this study are appropriately interpreted as evidence for the reliability of agentic AI on structured, well-defined analytical tasks rather than as a claim that agentic AI is ready to supplant expert judgment in all dimensions of biomedical research. The accumulated literature is unambiguous that human domain experts remain necessary for methodological guidance, cross-domain synthesis, and the generation of novel hypotheses from complex data [6]. Agentic AI is most productively understood as a collaborative augmentation: it can execute complex, time-consuming, error-prone analytical operations with quantifiable accuracy, freeing researchers to focus cognitive effort on the judgment-intensive dimensions of scientific work that AI cannot yet reliably perform.
Self-verification strategies in which agentic systems cross-check their own outputs against external databases before returning results have already demonstrated marked improvement over naive LLM output in gene-set analysis tasks [14] and biomedical fact-checking contexts [15]. The architecture of bystro THiNK, which operates through structured tool use and explicit data loading and transformation steps rather than relying solely on LLM inference, is consistent with this design philosophy.
Several limitations of this study should be clearly stated, as they define the appropriate scope of inference from the results.
Scope of task. This study evaluated a specific category of analytical task: tabular data aggregation, multi-level summarization, and figure generation from structured clinical genomics files. The results do not directly address the performance of bystro THiNK on free-text biomedical reasoning, open-ended hypothesis generation, variant interpretation from clinical narratives, or tasks requiring synthesis across heterogeneous information sources. Those capabilities are subject to the distinct and variable error profiles documented in the broader LLM literature [5, 12].
Dataset specificity. All analyses were performed on a single dataset (the MSK-IMPACT cBioPortal cohort) derived from a single institution and a single sequencing platform. Generalizability to other clinical genomics datasets, other data formats, or other institutional conventions has not been evaluated and cannot be assumed.
Benchmark is derived, not primary. The manual analysis used as the reference in this study represents the output of a human analyst using conventional tools, not a direct comparison to the original published MSK-IMPACT figures (from which the current analysis departs by approximately 0.5% due to pre-specified ambiguously categorized sample exclusions). Concordance between the two pipelines in this study does not imply exact numerical equivalence with the original manuscript.
No evaluation of novel analysis. This study evaluates the reproduction of an existing analysis, not the generation of novel analytical findings. Rediscovery accuracy is a necessary but not sufficient criterion for the use of AI in exploratory research.
Hallucination risk in prose outputs. The concordance results reported here apply specifically to computational outputs (tables and figures). LLM-generated narrative interpretation of analytical results, whether by bystro THiNK or any other system, remains subject to the hallucination and overconfidence risks documented in the literature [5, 12] and should always be reviewed by domain experts before publication.
This study provides the most quantitatively rigorous large-scale validation of an agentic AI system for clinical genomics data analysis published to date. On a dataset of 104,705 rows drawn from the MSK-IMPACT clinical sequencing cohort — a real-world, multi-format, multi-file clinical genomics dataset — bystro THiNK produced output that was 100% concordant with a human-manual reference analysis (95% CI: 99.9965% to 100%). The 95% upper bound on the true undetected error rate is 0.003%.
These results do not establish that agentic AI is appropriate for all dimensions of biomedical research, and they do not replace the need for domain expert oversight. They do establish, on a sound quantitative basis, that for the structured analytical tasks evaluated here — data aggregation, multi-level summarization, and figure generation from complex real-world clinical genomics data — bystro THiNK operates at a level of accuracy that is indistinguishable from experienced manual analysis and that satisfies the standards of peer-reviewed research. This finding, grounded in a benchmark anchored to the MSK-IMPACT Nature Medicine publication, provides researchers, bioinformaticians, and clinical institutions with the quantitative evidence needed to responsibly evaluate agentic AI as part of their research infrastructure.
As the field matures and the scope of validated tasks expands, the "rediscovery" paradigm introduced here by using published, independently peer-reviewed analyses as ground truth offers a principled and portable framework for establishing trust in agentic AI systems across domains.
Zehir A, Benayed R, Shah RH, Syed A, Middha S, Kim HR, Srinivasan P, Gao J, Chakravarty D, Devlin SM, Hellmann MD, Barron DA, Schram AM, Hameed M, Dogan S, Ross DS, Hechtman JF, DeLair DF, Yao J, Mandelker DL, Cheng DT, Chandramohan R, Mohanty AS, Ptashkin RN, Jayakumaran G, Prasad M, Syed MH, Rema AB, Liu ZY, Nafa K, Borsu L, Sadowska J, Casanova J, Bacares R, Kiecka IJ, Razumova A, Son JB, Stewart L, Baldi T, Mullaney KA, Al-Ahmadie H, Vakiani E, Abeshouse AA, Penson AV, Jonsson P, Camacho N, Chang MT, Won HH, Gross BE, Kundra R, Heins ZJ, Chen HW, Phillips S, Zhang H, Wang J, Ochoa A, Wills J, Eubank M, Thomas SB, Gardos SM, Reales DN, Galle J, Durany R, Cambria R, Abida W, Cercek A, Feldman DR, Gounder MM, Hakimi AA, Harding JJ, Iyer G, Janjigian YY, Jordan EJ, Kelly CM, Lowery MA, Morris LGT, Omuro AM, Raj N, Razavi P, Shoushtari AN, Shukla N, Soumerai TE, Varghese AM, Yaeger R, Coleman J, Bochner B, Riely GJ, Saltz LB, Scher HI, Sabbatini PJ, Robson ME, Klimstra DS, Taylor BS, Baselga J, Schultz N, Hyman DM, Arcila ME, Solit DB, Ladanyi M, Berger MF. (2017). Mutational landscape of metastatic cancer revealed from prospective clinical sequencing of 10,000 patients across 58 principal cancer types. Nature Medicine, 23(6), 703–713. https://doi.org/10.1038/nm.4333
Kwon D. (2025). Is it OK for AI to write science papers? Nature survey shows researchers are split. Nature 641, 574-578. https://doi.org/10.1038/d41586-025-01463-8
Ruediger D, McCracken C, Skinner M. (2025). Adoption of Generative AI by Academic Biomedical Researchers. Ithaka S+R. Ithaka S+R. 17 October 2024. Web. 25 June 2026. https://doi.org/10.18665/sr.321415
Van Noorden R and Perkel JM. (2023). AI and science: what 1,600 researchers think. Nature 621, 672-675. https://doi.org/10.1038/d41586-023-02980-0
Chelli M, Descamps J, Lavoué V, Trojani C, Azar M, Deckert M, Raynier JL, Clowez G, Boileau P, Ruetsch-Chelli C. (2024). Hallucination Rates and Reference Accuracy of ChatGPT and Bard for Systematic Reviews: Comparative Analysis. Journal of Medical Internet Research, 26, e53164. https://doi.org/10.2196/53164
Johri S, Pimenta E, Yates J, Fu J, Bao EL, Jun H, Reardon B, Bacot S, Shady M, Fu D, Mei W, Camp SY, Park J, Van Allen E. (2026). Evaluating agentic AI for biological discovery in autonomous and copilot settings. bioRxiv [Preprint]. https://doi.org/10.64898/2026.06.04.729919
Cheng DT, Mitchell TN, Zehir A, Shah RH, Benayed R, Syed A, Chandramohan R, Liu ZY, Won HH, Scott SN, Brannon AR, O'Reilly C, Sadowska J, Casanova J, Yannes A, Hechtman JF, Yao J, Song W, Ross DS, Oultache A, Dogan S, Borsu L, Hameed M, Nafa K, Arcila ME, Ladanyi M, Berger MF. (2015). Memorial Sloan Kettering–Integrated Mutation Profiling of Actionable Cancer Targets (MSK-IMPACT): A hybridization capture-based next-generation sequencing clinical assay for solid tumor molecular oncology. Journal of Molecular Diagnostics, 17(3), 251–264. https://doi.org/10.1016/j.jmoldx.2014.12.006
Cerami E, Gao J, Dogrusoz U, Gross BE, Sumer SO, Aksoy BA, Jacobsen A, Byrne CJ, Heuer ML, Larsson E, Antipin Y, Reva B, Goldberg AP, Sander C, Schultz N. (2012). The cBio cancer genomics portal: An open platform for exploring multidimensional cancer genomics data. Cancer Discovery, 2(5), 401–404. https://doi.org/10.1158/2159-8290.CD-12-0095
Sorin V, Klang E, Sklair-Levy M, Cohen I, Zippel DB., Balint Lahat N, Konen E, Barash Y. (2023). Large language model (ChatGPT) as a support tool for breast tumor board. npj Breast Cancer, 9, 44. https://doi.org/10.1038/s41523-023-00557-8
Jin Q, Wang Z, Floudas CS, Chen F, Gong C, Bracken-Clarke D, Xue E, Yang Y, Sun J, Lu Z. (2024). Matching patients to clinical trials with large language models. Nature Communications, 15, 9074. https://doi.org/10.1038/s41467-024-53081-z
Callies A, Bodinier Q, Ravaud P, Davarpanah K. (2025). Real-world validation of a multimodal LLM-powered pipeline for high-accuracy clinical trial patient matching. *Communications Medicine, *5, 536. https://doi.org/10.1038/s43856-025-01256-0
Rydzewski NR, Dinakaran D, Zhao SG, Ruppin E, Turkbey B, Citrin DE, Patel KR. (2024). Comparative evaluation of LLMs in clinical oncology. NEJM AI, 1, 5. https://doi.org/10.1056/aioa2300151
Hu M, Alkhairy S, Lee I, Pillich RT, Fong D, Smith K, Bachelder R, Ideker T, Pratt D. (2025). Evaluation of large language models for discovery of gene set function. Nature Methods, 22, 82-91. https://doi.org/10.1038/s41592-024-02525-x
Wang Z, Jin Q, Wei CH, Tian S, Lai PT, Zhu Q, Day CP, Ross C, Leaman R, Lu Z. (2025). GeneAgent: Self-verification language agent for gene-set analysis using domain databases. Nature Methods, 22, pages 1677–1685. https://doi.org/10.1038/s41592-025-02748-6
Reisle C, Grisdale CJ, Krysiak K, Danos AM, Khanfar M, Pleasance E, Saliba J, Hanos M, Patel NV, Jain A, McMichael JF, Venigalla AC, Griffith M, Griffith OL, Jones SJM. (2025). Evaluating language models for biomedical fact-checking: A benchmark dataset for cancer variant interpretation verification. bioRxiv. https://doi.org/10.1101/2025.09.10.675443
Lin KH, Kao T-H, Wang L-C, Kuo C-T, Chen PC-H, Chu Y-C, Yeh Y-C. (2025). Benchmarking large language models GPT-4o, Llama 3.1, and Qwen 2.5 for cancer genetic variant classification. npj Precision Oncology, 9, 141. https://doi.org/10.1038/s41698-025-00935-4
Table 1. Summary statistics for data sets. Analysis was conducted as described in the Methods section for primary data from the MSK-IMPACT data set, the master data table prepared using bystro THiNK, and manual analysis. PRIMARY_DATA refers to the cBioPortal data set, BYSTRO_THiNK to the master data table created by bystro THiNK, and MANUAL to the master data table created using conventional tools. DELTA_% shows the percent difference between neighboring columns — for comparison of the primary data with data produced by bystro THiNK, the primary data value is the divisor.
| PRIMARY_DATA | DELTA_% | ¹ BYSTRO_THiNK | DELTA_% | ¹ MANUAL | |
|---|---|---|---|---|---|
| PATIENTS | 10336 | 0.29% | 10306 | 0.00% | 10306 |
| SAMPLES | 10945 | 0.59% | 10880 | 0.00% | 10880 |
| CANCER TYPES | 58 | 0.00% | 58 | 0.00% | 58 |
| MUT SAMPLES | 10129 | 0.60% | 10068 | 0.00% | 10068 |
| MUT PATIENTS | 9593 | 0.31% | 9563 | 0.00% | 9563 |
| MUT GENES | 414 | 0.00% | 414 | 0.00% | 414 |
| CNA SAMPLES | 5219 | 0.46% | 5195 | 0.00% | 5195 |
| CNA PATIENTS | 4986 | 0.36% | 4968 | 0.00% | 4968 |
| CNA GENES | 409 | 0.00% | 409 | 0.00% | 409 |
| SV SAMPLES | 1667 | 0.48% | 1659 | 0.00% | 1659 |
| SV PATIENTS | 1598 | 0.31% | 1593 | 0.00% | 1593 |
| SV GENES | 1074 | 0.47% | 1069 | 0.00% | 1069 |
¹ Note that the manual and bystro THiNK master data tables contain fewer samples than the primary data because samples from 30 individuals were excluded as described.
Table 2. Patient samples associated with multiple cancer types. During analysis of data_clinical_patient.txt and data_mutations.txt source files in the MSK-IMPACT data set, bystro THiNK flagged sample data inconsistencies: samples from 30 patients had multiple cancer types associated with them and were excluded from analysis. Since replication of Figure 2a involved cancer type counts at the patient level and, in the manuscript figure, the patient total is 10366, each patient must be represented with only one cancer type. Hence, removal of patients with multiple associated tumor types is essential because it is arbitrary which sample is retained for the patient level counts. There are a total of 65 samples associated with the 30 patients in this table, but only samples with conflicting cancer types are listed.
| PATIENT_ID | SAMPLE_1_ID | ONCOTREE | SAMPLE_2_ID | ONCOTREE |
|---|---|---|---|---|
| P-0000423 | P-0000423-T01-IM3 | BLCA | P-0000423-T02-IM3 | IDC |
| P-0000675 | P-0000675-T01-IM3 | PRNE | P-0000675-T02-IM3 | COAD |
| P-0000950 | P-0000950-T02-IM3 | LUAD | P-0000950-T01-IM3 | SBC |
| P-0002119 | P-0002119-T01-IM3 | HCC | P-0002119-T02-IM5 | IDC |
| P-0002234 | P-0002234-T02-IM3 | IDC | P-0002234-T01-IM3 | CCRCC |
| P-0003260 | P-0003260-T02-IM5 | SBWDNET | P-0003260-T01-IM5 | LUAD |
| P-0003504 | P-0003504-T01-IM5 | BLCA | P-0003504-T02-IM5 | PRNE |
| P-0003602 | P-0003602-T02-IM5 | AMPCA | P-0003602-T01-IM5 | PRNE |
| P-0004121 | P-0004121-T01-IM5 | LUAD | P-0004121-T02-IM5 | IDC |
| P-0004430 | P-0004430-T02-IM5 | AASTR | P-0004430-T01-IM5 | THPD |
| P-0004657 | P-0004657-T01-IM5 | GIST | P-0004657-T02-IM5 | DDLS |
| P-0004733 | P-0004733-T01-IM5 | BLCA | P-0004733-T02-IM5 | LUAD |
| P-0004954 | P-0004954-T01-IM5 | COAD | P-0004954-T02-IM5 | SBWDNET |
| P-0005741 | P-0005741-T01-IM5 | PAMPCA | P-0005741-T02-IM5 | PAAD |
| P-0005753 | P-0005753-T01-IM5 | THPD | P-0005753-T02-IM5 | CCRCC |
| P-0005937 | P-0005937-T01-IM5 | PAAD | P-0005937-T02-IM5 | LUAD |
| P-0006199 | P-0006199-T01-IM5 | LUAD | P-0006199-T03-IM5 | HCC |
| P-0007036 | P-0007036-T02-IM5 | IDC | P-0007036-T01-IM5 | COAD |
| P-0007076 | P-0007076-T03-IM5 | CUP | P-0007076-T02-IM5 | PAAD |
| P-0007513 | P-0007513-T02-IM5 | LUAD | P-0007513-T01-IM5 | GIST |
| P-0007772 | P-0007772-T01-IM5 | ACYC | P-0007772-T02-IM5 | THPD |
| P-0007911 | P-0007911-T01-IM5 | LUAD | P-0007911-T02-IM5 | THPD |
| P-0008055 | P-0008055-T02-IM5 | ANSC | P-0008055-T01-IM5 | ECD |
| P-0008167 | P-0008167-T02-IM5 | LUAD | P-0008167-T01-IM5 | COAD |
| P-0008595 | P-0008595-T02-IM5 | BLCA | P-0008595-T01-IM5 | IDC |
| P-0009061 | P-0009061-T02-IM5 | HCC | P-0009061-T01-IM5 | HGSOC |
| P-0009345 | P-0009345-T01-IM5 | MUP | P-0009345-T02-IM5 | THPD |
| P-0010130 | P-0010130-T01-IM5 | LUAD | P-0010130-T02-IM5 | SCLC |
| P-0011043 | P-0011043-T01-IM5 | LUAD | P-0011043-T02-IM5 | PAAD |
| P-0011239 | P-0011239-T01-IM5 | PAAD | P-0011239-T02-IM5 | COAD |
Table 3. Alteration type re-coding table. Mutation (MUT), Copy Number Alteration (CNA), and Structural Variant data from the source files contained coding different from what was used in the MSK-IMPACT figures, so the data were re-coded as shown in this table to align the alteration field in the manual and bystro THiNK master data tables with the published figures.
| FILE | ORIGINAL_VALUE | NEW_VALUE | |
|---|---|---|---|
| CNA | 2 | > | Amplification |
| CNA | -2 | > | Deletion |
| MUT | Missense_Mutation | > | Missense |
| MUT | Frame_Shift_Del | > | Frameshift |
| MUT | Frame_Shift_Ins | > | Frameshift |
| MUT | Nonsense_Mutation | > | Nonsense |
| MUT | Splice_Site | Splice_Site | |
| MUT | 5’Flank | 5’Flank | |
| MUT | In_Frame_Ins | > | In Frame |
| MUT | In_Frame_Del | > | In Frame |
| MUT | 3’Flank | 3’Flank | |
| MUT | Translation_Start_Site | Translation_Start_Site | |
| MUT | Intron | Intron | |
| MUT | 5’UTR | > | Promoter |
| MUT | Nonstop_Mutation | Nonstop_Mutation | |
| MUT | Splice_Region | Splice_Region | |
| SV | TRANSLOCATION | > | Fusion |
| SV | INVERSION | > | Fusion |
| SV | DUPLICATION | > | Fusion |
| SV | DELETION | > | Fusion |
Table 4. Count discrepancies between Figure 2a and manual count of source data. Cancer types with count discrepancies greater than 10% are shown. ABS_DELTA_% is the absolute difference between published and manual counts from the data_clinical_sample.txt source file divided by the published counts expressed as a percentage.
| CANCER_TYPE | FIG 2A_COUNT | MANUAL_COUNT | DELTA | ABS_DELTA_% |
|---|---|---|---|---|
| Bone Cancer | 42 | 129 | 87 | 207% |
| Non-Hodgkin Lymphoma | 159 | 5 | 154 | 97% |
| Embryonal Tumor | 76 | 6 | 70 | 92% |
| Gestational Trophoblastic Disease | 11 | 3 | 8 | 73% |
| Hepatobiliary Cancer | 242 | 345 | 103 | 43% |
| Ampullary Cancer | 25 | 16 | 9 | 36% |
| Gastrointestinal Neuroendocrine Tumor | 53 | 44 | 9 | 17% |
| Cancer of Unknown Primary | 160 | 181 | 21 | 13% |
¹ In all cases, manual counts and cBioPortal counts are in closer agreement than manual or bystroTHiNK with manuscript Fig 2A counts.
