Ancestry Calculation Dashboard
The ancestry calculation runs automatically after cohort analysis and provides population ancestry estimates using a probabilistic PCA and XGBoost pipeline trained on 1000 Genomes Phase 3 data.
Dashboard Preview
After your data is processed, the ancestry dashboard displays population ancestry estimates for 5 main superpopulations using a sophisticated probabilistic PCA and XGBoost classifier pipeline. The analysis is robust to missing data and remains highly accurate even with significant amounts of missing genetic information.
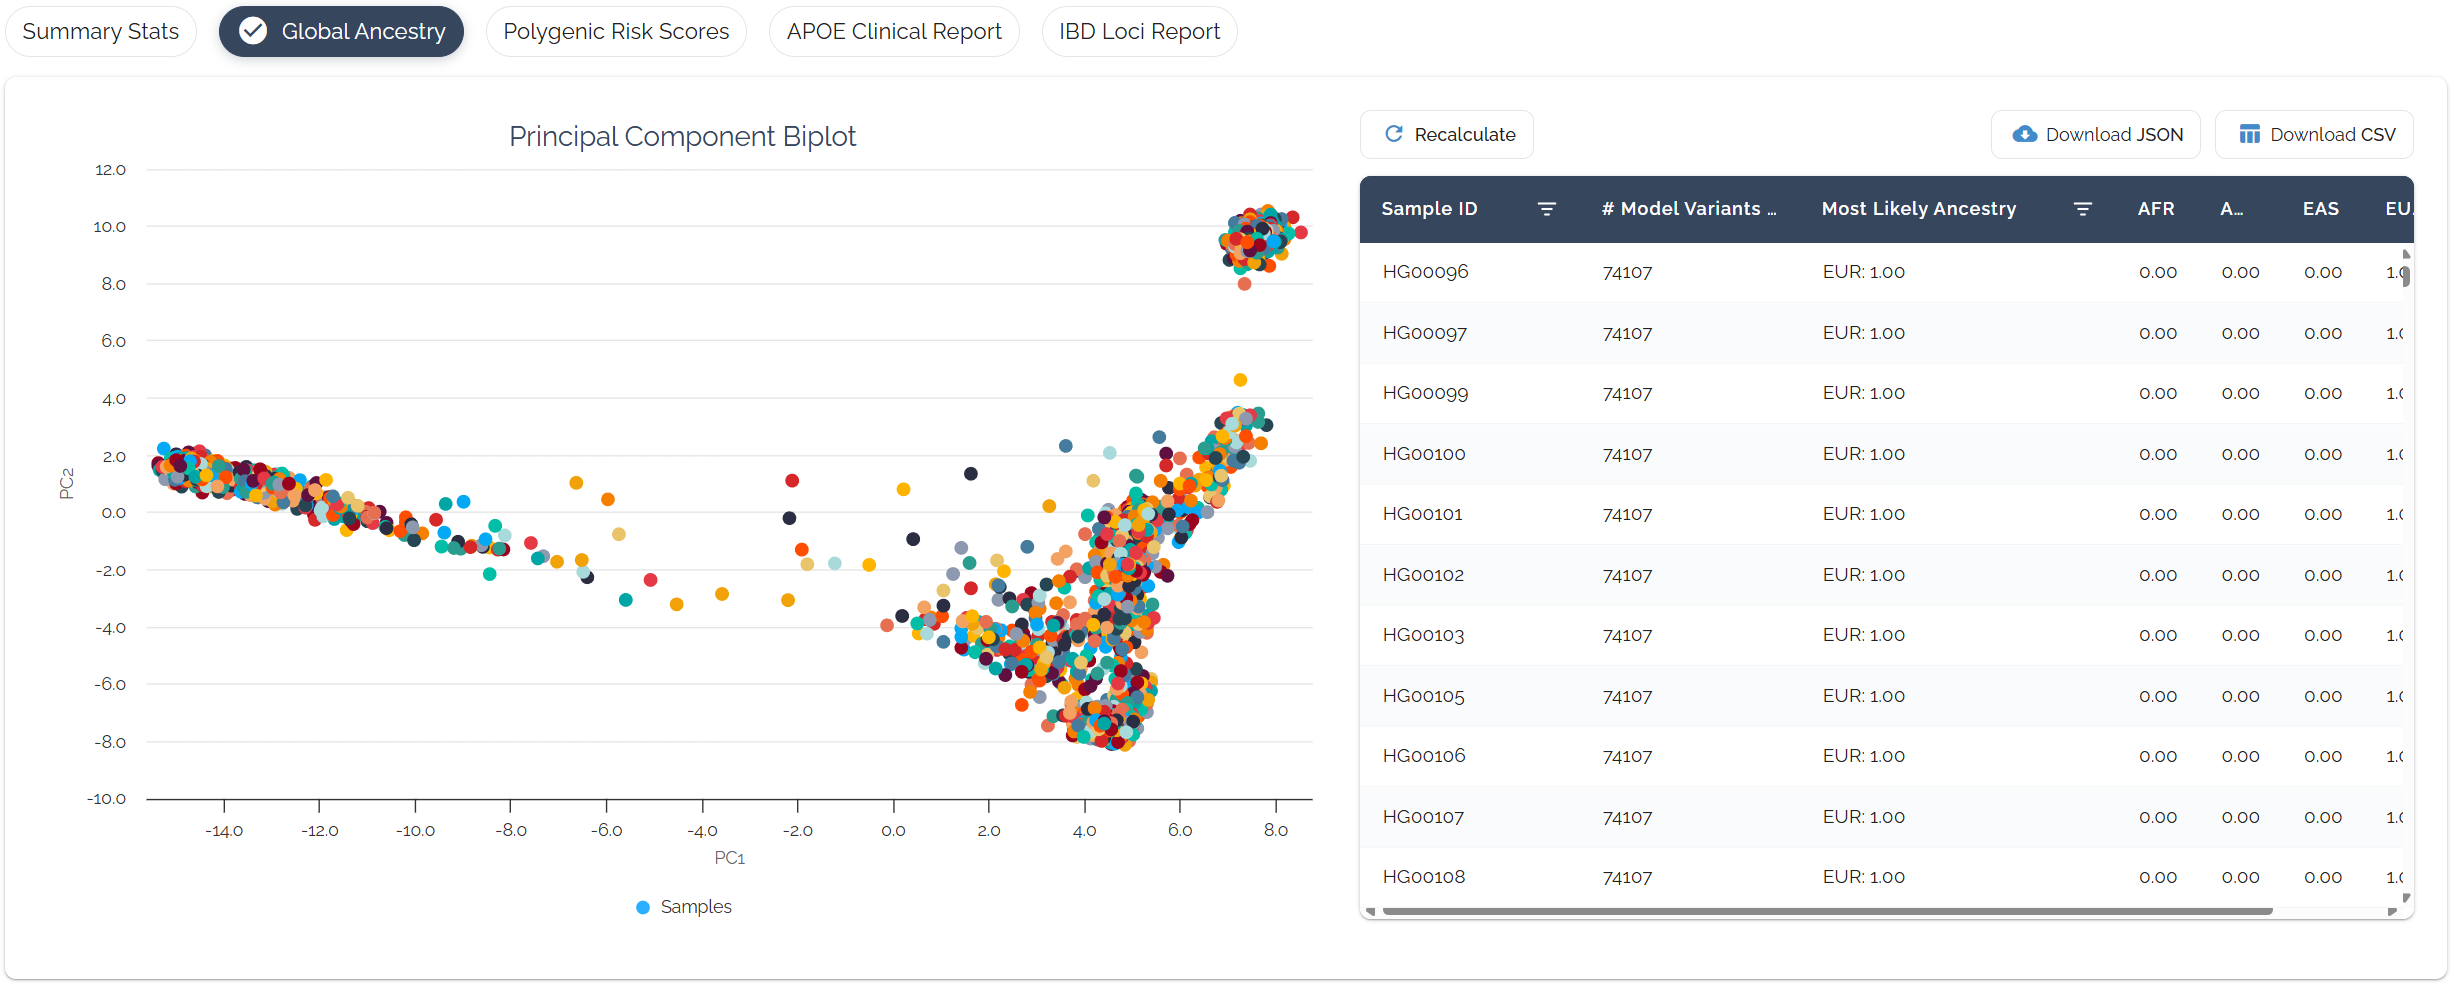
Example ancestry dashboard displaying the interactive biplot (left) showing sample position relative to 1000 Genomes reference populations, and population probability table (right) with predicted ancestry percentages for each superpopulation.
Superpopulations Analyzed
Based on the 1000 Genomes Project classification system:
- EUR - European
- AFR - African
- EAS - East Asian
- SAS - South Asian
- AMR - Admixed American
Dashboard Components
📊PC1 vs PC2 Biplot Visualization
Interactive scatter plot showing your sample's position relative to reference populations on the first two principal components.
What to look for:
Your sample will appear as a distinct point, with its position indicating ancestry composition. Closer proximity to reference population clusters suggests higher ancestry probability.
📈Population Probability Table
Percentage probabilities for each of the 5 superpopulations, with the highest probability determining predicted ancestry. These percentages do not represent ancestral contributions to admixture.
Example output:
🔢SNP Coverage Information
Summary of the genetic variants included in your ancestry calculation.
Information displayed:
- ▶Number of SNPs used in calculation
Note: The system automatically selects the most appropriate reference model (gnomAD or array intersection) based on your data characteristics.
Reference Models
Bystro uses two high-quality SNP reference sets for ancestry calculation, automatically selecting the most appropriate model based on your data:
gnomAD Model
Uses the same SNP set that gnomAD employs for population ancestry calculations (74,107 variants).
Best for:Whole genome and exome sequencing data
Array Intersection Model
Intersection of SNPs from Affymetrix PMRA and Illumina 660 arrays (33,704 variants).
Best for:SNP array and targeted sequencing data
Interpreting Your Results
- ▶Results are based on genetic markers and population genetics, not genealogical ancestry
- ▶Maintains 99% accuracy with up to 80% missing SNPs, and 90% accuracy with up to 99% missingness
- ▶Works well even with unequal variant distribution (e.g., targeted sequencing of specific chromosomes)
- ▶Probabilities are calculated independently - they may not sum to 100% until normalized
Understanding the Visualization
- ▶Sample Position:Your sample appears as a distinct point on the biplot
- ▶Reference Clusters:Population groups are represented as colored clusters
- ▶Distance:Closer proximity to a cluster indicates higher ancestry probability
Quality Indicators
- ✓High confidence:>20% of model SNPs present (optimal performance)
- ⚠Medium confidence:5-20% of model SNPs present (still highly accurate)
- !Lower confidence:<5% of model SNPs present (reduced accuracy but still functional)