Review Your Search Results
After running any search, Bystro provides a quick summary of your results and tools to help you understand and refine your query. Learn how to interpret result counts, performance metrics, and use the information to improve your analysis.
Search Results Summary
Every search displays a simple summary showing exactly what was found and how quickly the search completed.
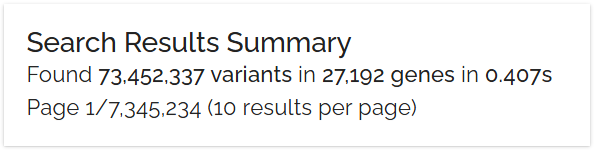
The search results summary line provides instant feedback on your query scope and performance
Found 21,353 variants in 18 genes in 0.024s21,353 variants
Total variants matching your search criteria
18 genes
Unique genes containing matching variants
0.024s
Query execution time
Pagination Information
Below the summary, pagination details help you navigate large result sets efficiently.
Page 1/2,136 (10 results per page)You're viewing page 1 of 2,136 total pages, with 10 variants displayed per page. Adjust results per page or jump to specific pages as needed.
ClinVar Category Breakdown
Bystro automatically categorizes your variants by clinical significance. Click any category to filter your results.

ClinVar category buttons provide quick filtering by clinical significance and risk level
High / Moderate Risk
Disease-causing variants with established clinical evidence. These require immediate attention in clinical settings.
Low Risk
Variants with no known clinical significance. Often common population variants.
Reduces Risk
Variants that may provide protection against certain diseases. Less common but important for research.
Affects Drug Response
Pharmacogenomic variants affecting drug metabolism, efficacy, or adverse reactions.
Variable Impact
Variants of uncertain significance (VUS) or with conflicting interpretations.
Filters and Aggregation Panel
The Filters and Aggregation panel summarizes results across all annotation fields. Click any field to see value distributions and apply filters.
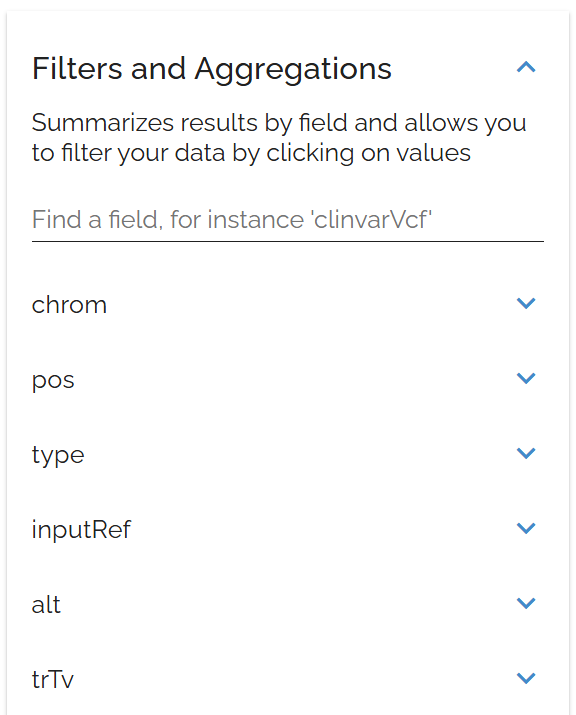
The Filters and Aggregation panel lets you explore data distributions and apply precise filters
Key Features
Useful Field Categories
Start by expanding high-level fields like refSeq.siteType or clinvarVcf.CLNSIG to get an overview:
See the distribution of variant types (exonic, intronic, etc.)
Check clinical significance breakdown.
Identify most frequent genes or chromosomes.
Spot data quality issues or unexpected patterns.
Interpreting Your Results
Large Result Sets (10,000+)
Small Result Sets (under 1,000)
Bystro's optimized indexing typically returns results in under 0.1 seconds, even for complex queries across large datasets. If queries take longer:
Check if you're using very broad search terms.
Consider breaking complex queries into smaller parts.
Use more specific field searches rather than general text search.
Next Steps After Review
Refine Your Search
Too many results? Add frequency thresholds, filter by variant impact, or specify genomic regions.
Sort and Prioritize
Sort by CADD scores, order by frequency, or group by gene or function.
Save Your Results
Save the search for later, export to analysis tools, or share with collaborators.