Polygenic Risk Score Dashboard
Calculate ancestry-aware polygenic risk scores with automated variant QC, ancestry-matched allele frequency adjustment, LD-aware clumping, and continuous shrinkage. PRS analysis runs automatically after ancestry calculation.
Available Analyses
Built-in polygenic risk scores:
You can also add your own — see Custom Summary Statistics below.
What You'll See
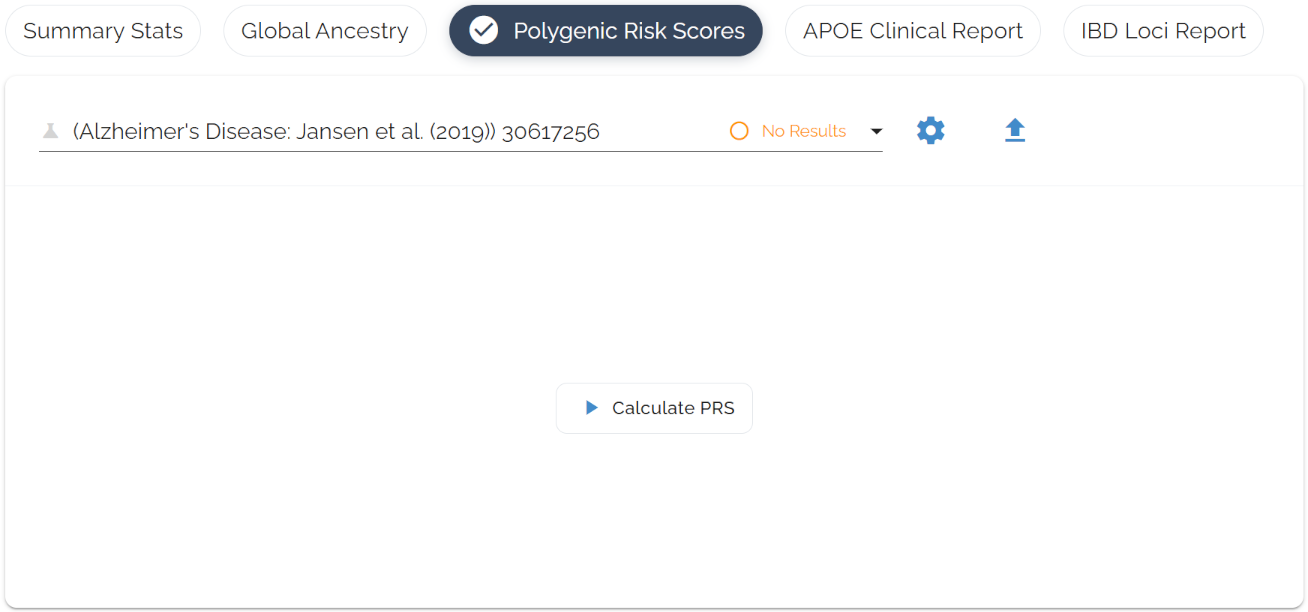
Analysis Control Panel
One-click interface to start analysis. Select a disease, hit “Calculate PRS,” and watch the real-time progress indicator.
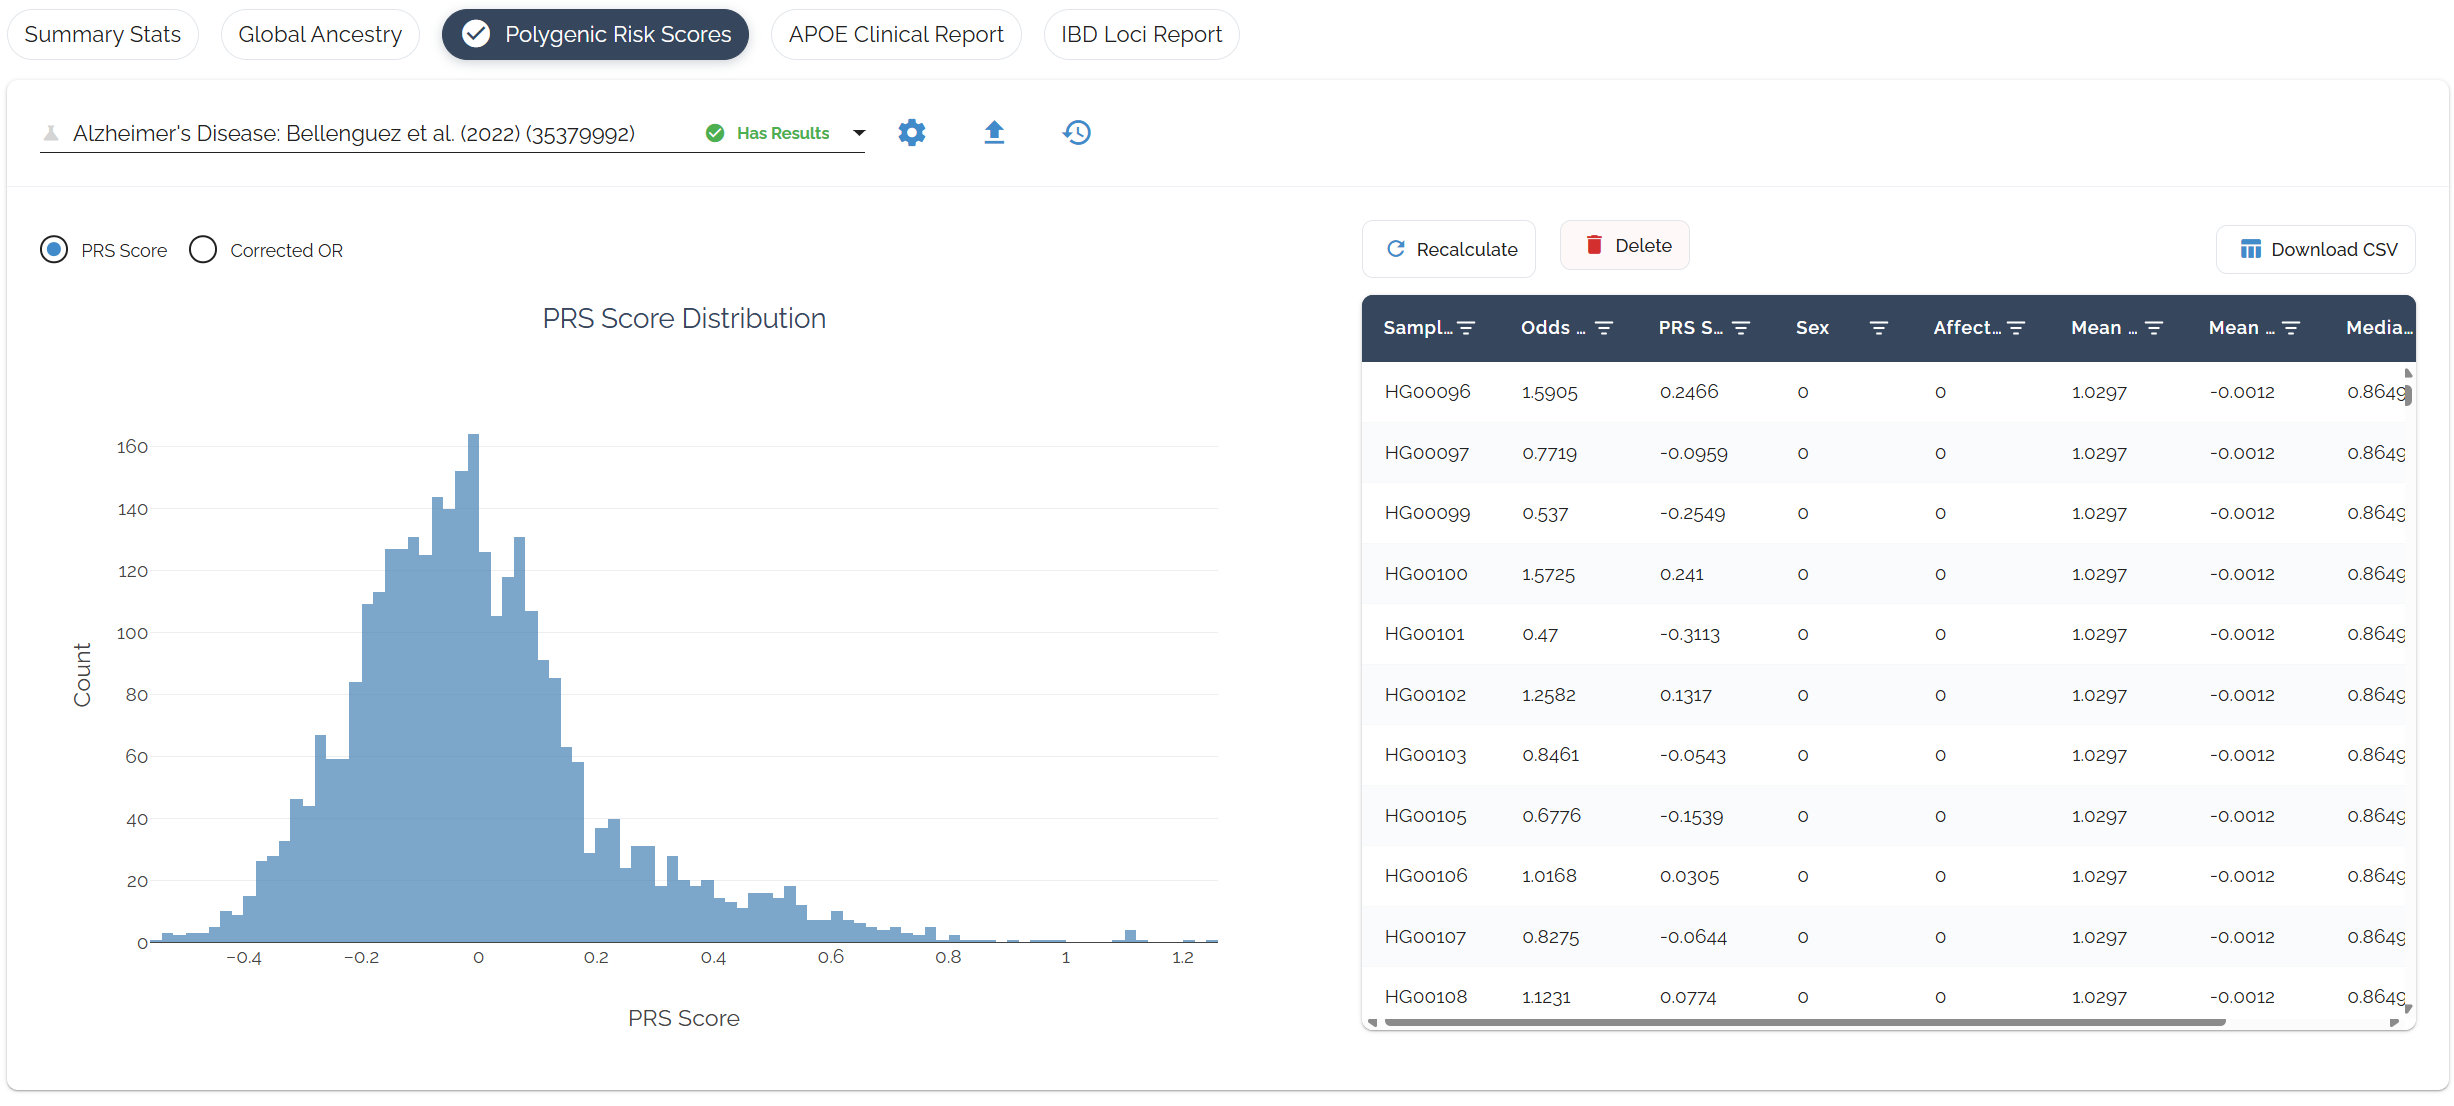
Risk Score Results
Ancestry-adjusted risk scores with percentiles calculated within your ancestry group. Odds ratios are converted to liability-scale betas and dosages are centered by ancestry-matched allele frequencies for accurate cross-population interpretation.
Understanding Your Results
Reading the Table
Risk Levels
Based on ancestry-corrected odds ratios:
OR < 0.67OR 0.67–1.49OR 1.5–2.9OR 3.0–4.9OR ≥ 5.0Share with healthcare providers for personalized guidance.
Consider lifestyle modifications for higher-risk conditions.
Use to inform timing and frequency of medical screening.
Custom Summary Statistics
You can run PRS on virtually any trait by uploading GWAS summary statistics from the NHGRI-EBI GWAS Catalog. Thousands of studies provide harmonized files covering a wide range of diseases and traits. Download one and upload it to run through Bystro's full ancestry-aware PRS pipeline.
Finding Files in the GWAS Catalog
Search for your trait
Go to ebi.ac.uk/gwas and search for a disease or trait (e.g., “type 2 diabetes”, “breast cancer”).
Find a study with summary statistics
Not every study has downloads. Look for a summary statistics link on the study page. Larger, more recent studies are more likely to have one.
Download the harmonized file
The catalog provides both original and harmonized files. Download the harmonized version — it ends in h.tsv.gz.
Upload to Bystro
Upload the file as-is. No preprocessing needed.
Upload Walkthrough
Click the upload icon on the PRS dashboard to go through the 3-step upload process:
Study Metadata
Label your study so you can identify it in your results.
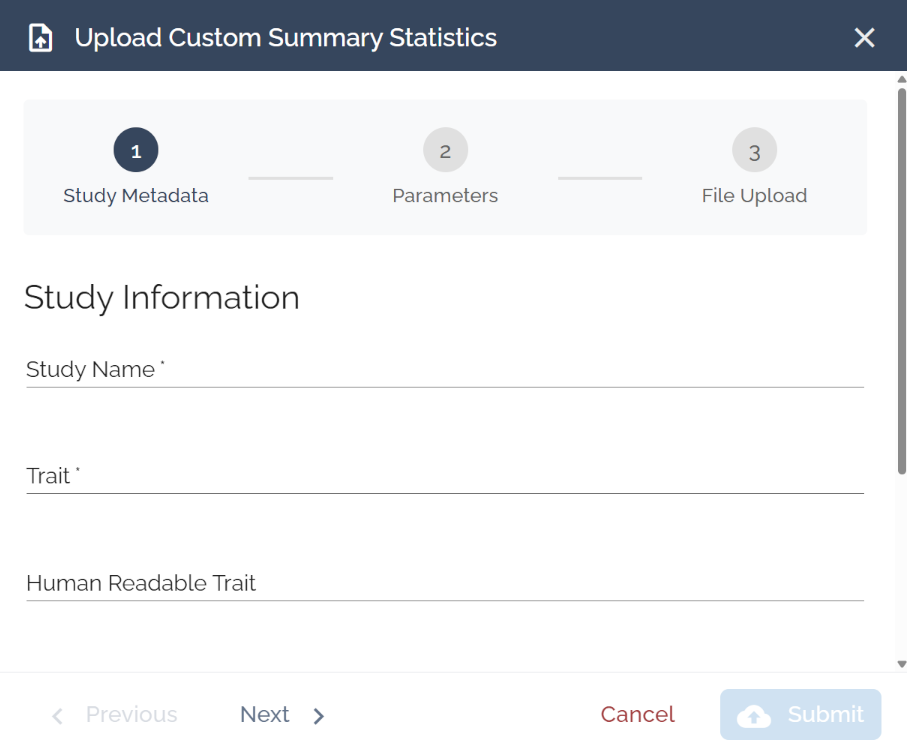
Study Name: e.g., “Jansen et al 2019” or “T2D Risk - Mahajan 2022”
Trait: Short code, e.g., “AD” or “T2D”
Human Readable Trait: Plain-language name shown in results, e.g., “Alzheimer's Disease”
Parameters
Analysis parameters for the PRS calculation. Defaults work well for most studies. Adjust only if you have specific requirements.
File Upload
Select ‘Choose hg19 file’ or ‘Choose hg38 file’ and hit submit. You need at least one build, but can upload both.
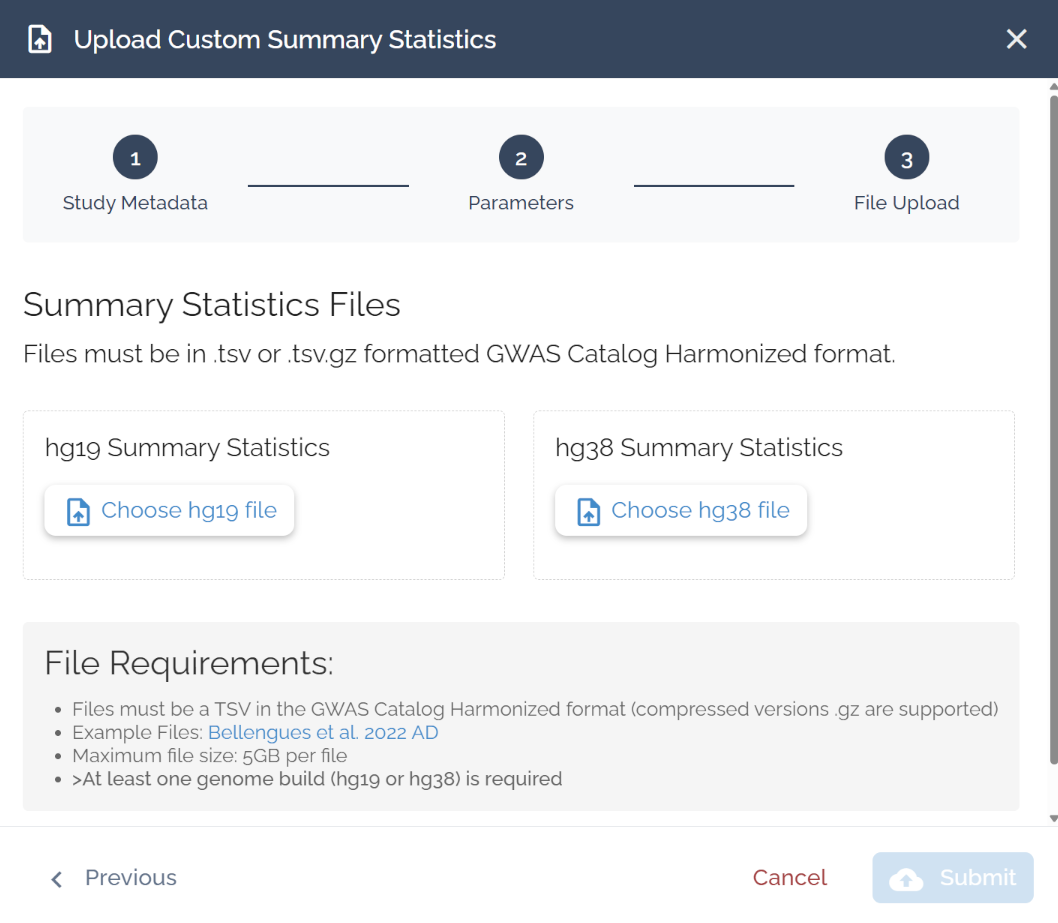
File Requirements
Format: TSV in GWAS Catalog Harmonized format (.tsv or .tsv.gz)
Max size: 5 GB per file
Methodology
Bystro's PRS uses algorithms developed by David Cutler at Emory University, with continuous shrinkage methods optimized for terabyte-scale datasets.