Variant Report Dashboard
Generate customizable variant reports for specific genes and SNPs of interest. These reports are dynamically created using Bystro's rapid query language and can be tailored for each research deployment.
How It Works
Variant reports provide focused genetic analysis on specific variants or genes that researchers want to examine. Reports are generated dynamically using Bystro's query language, allowing for rapid searching and customization based on research needs.
Available Report Types
APOE Variant Summary
Comprehensive analysis of APOE genotypes with visual summaries and individual breakdowns.
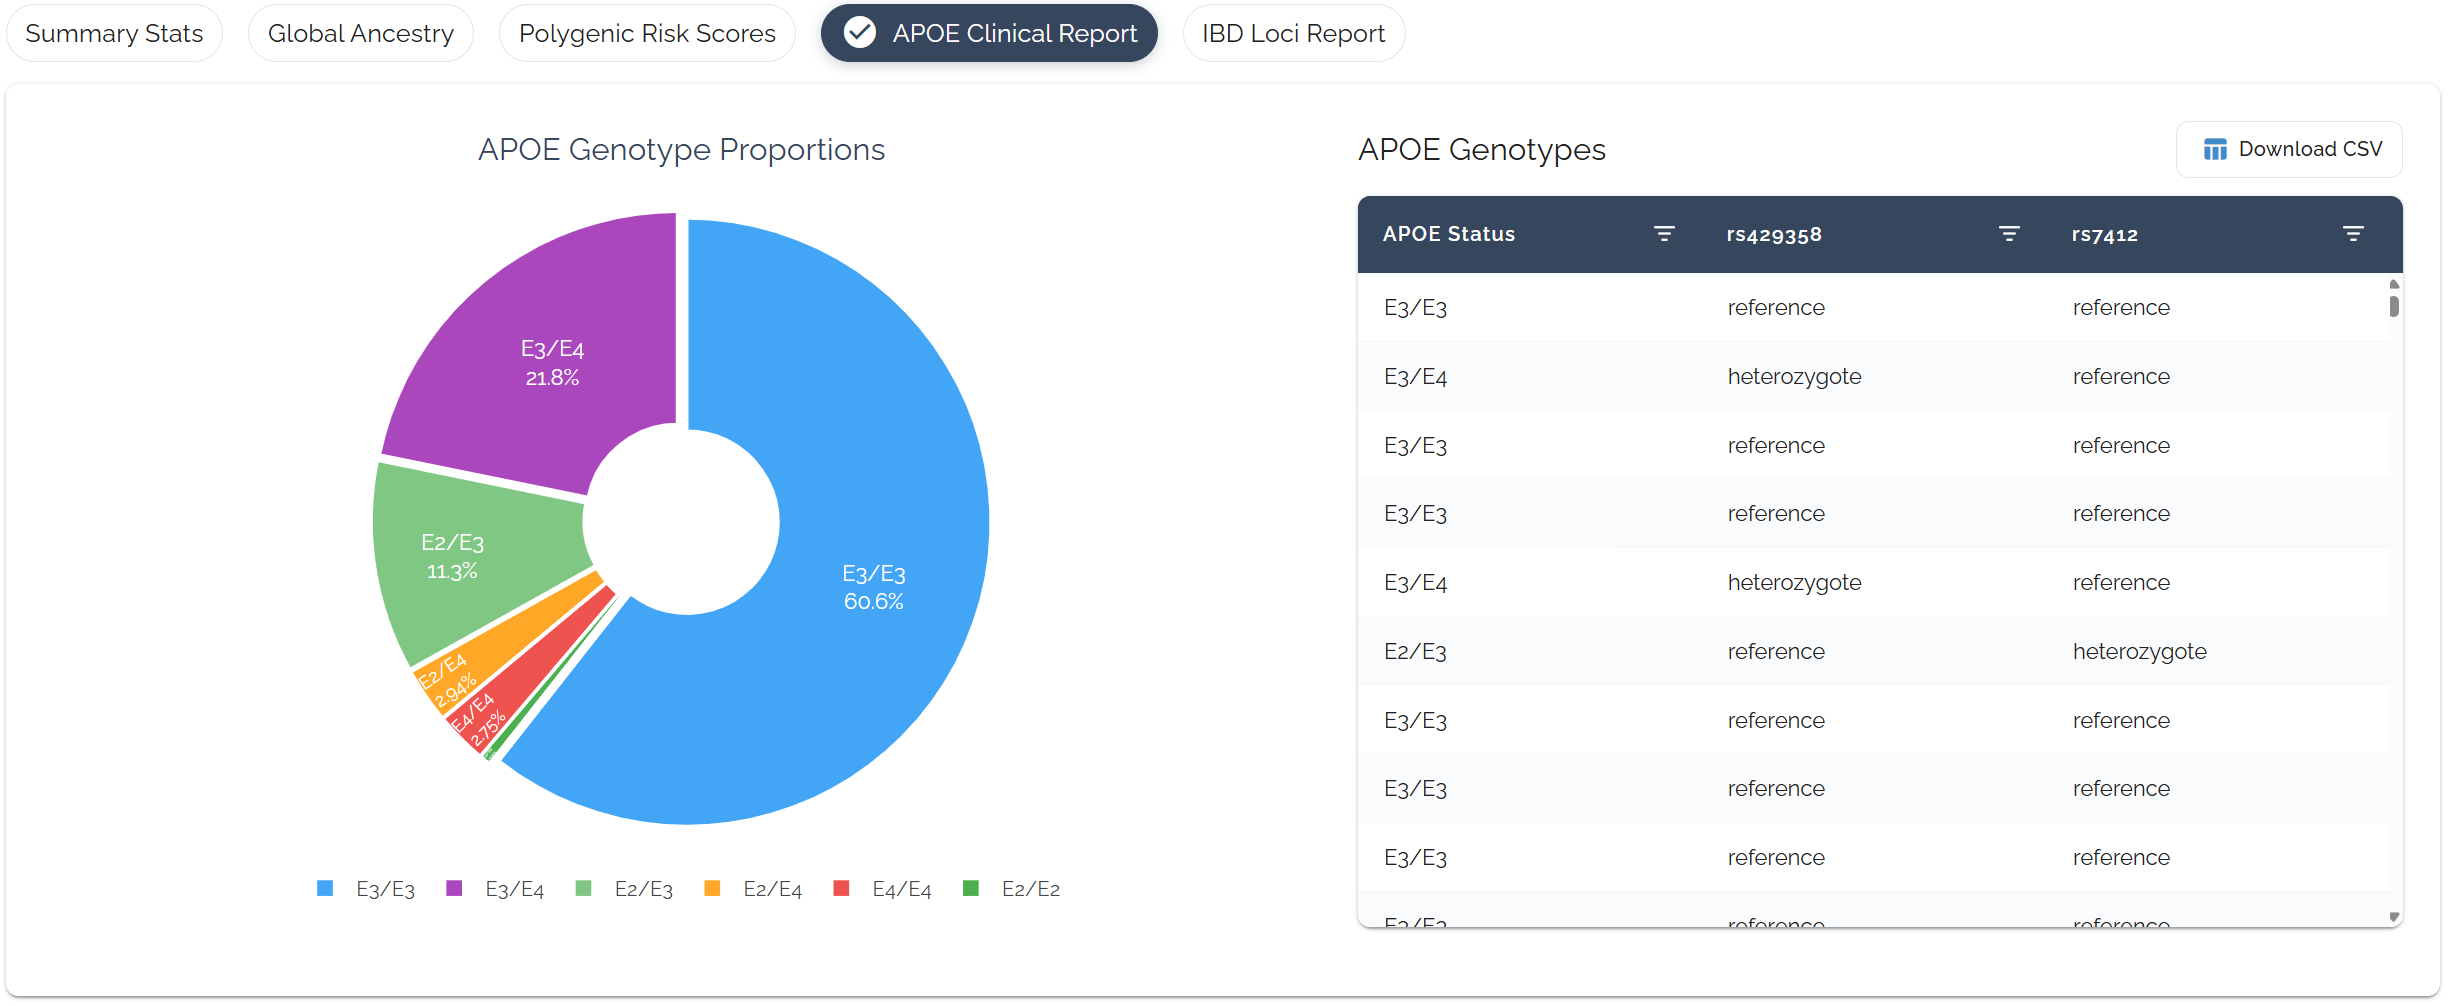
Interactive pie chart showing APOE genotype distribution and detailed table with individual genotypes
IBD Variant Report
Focused analysis of inflammatory bowel disease-associated SNPs that researchers want to examine.
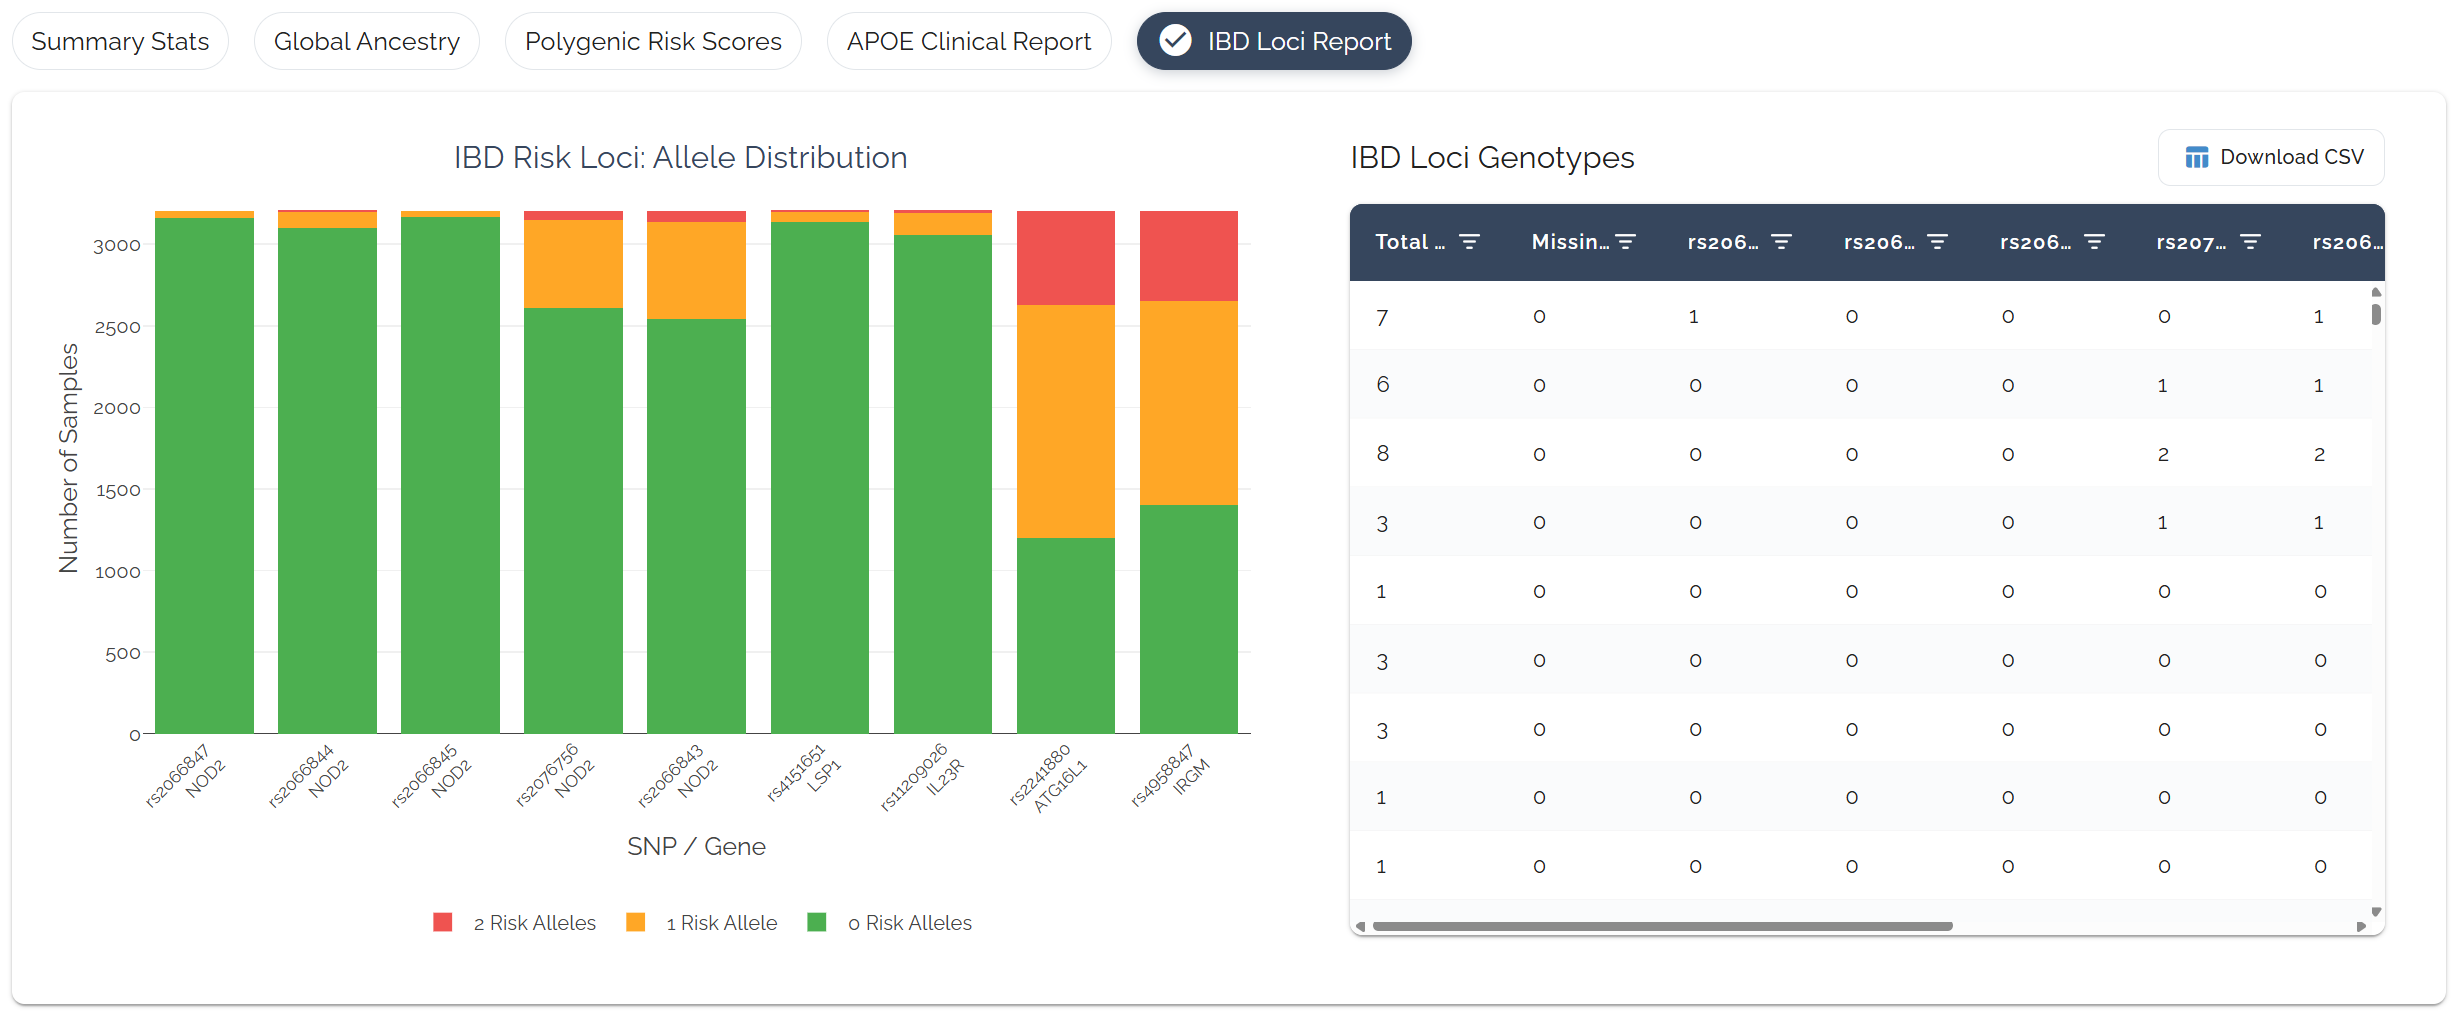
List of top IBD-associated SNPs selected by researchers with per-individual genotype status for each SNP
Customization Options
Variant reports are customized for our enterprise deployments and can be tailored to specific research needs using Bystro's powerful query language.
Reports are generated using Bystro's rapid query language, allowing researchers to specify exactly which variants and individuals to include.
Benefit: Fast, flexible data extraction tailored to research questions
Each research deployment can have different variant reports configured based on the study's focus and research priorities.
Examples: Cancer studies might focus on tumor suppressor genes, cardiovascular studies on lipid metabolism variants
Researchers can specify which SNPs or genes are most relevant to their study, creating focused variant reports.
Flexibility: Add, remove, or modify variant lists based on evolving research needs
Technical Implementation
Rapid Data Processing
- ▶Query Language: Custom syntax for rapid genetic data searching
- ▶Dynamic Generation: Reports created on-demand based on current data
- ▶Scalable Architecture: Handles large cohorts efficiently
Output Formats
- ▶Interactive Tables: Sortable, filterable data views
- ▶Visual Charts: Pie charts, bar graphs for distribution summaries
- ▶Exportable Data: Download results for further analysis